


Sleep Well for decades: S&P Global ($SPGI)
The "Swiss Army knife” of financial markets


1. Summary
1.1. Investment Idea
S&P Global Inc. (NYSE: SPGI) is a financial intelligence juggernaut with deep roots and an even deeper moat. It’s best known as one of the “Big Three” credit rating agencies, but today S&P Global is much more – spanning market data, indices, commodities, and analytics. The investment thesis is that SPGI offers a boring compelling blend of stable, high-margin businesses and secular growth drivers that can compound returns over years. It operates in oligopolistic markets (like credit ratings and indexes) where it holds dominant share, underpinning pricing power and resilience. In fact, S&P and Moody’s together command roughly 80% of the international credit ratings market, with Fitch making up most of the rest.
This near-duopoly (≈95% global share) creates a formidable barrier to entry and steady demand through all market cycles.
1.2. Why SPGI is compelling
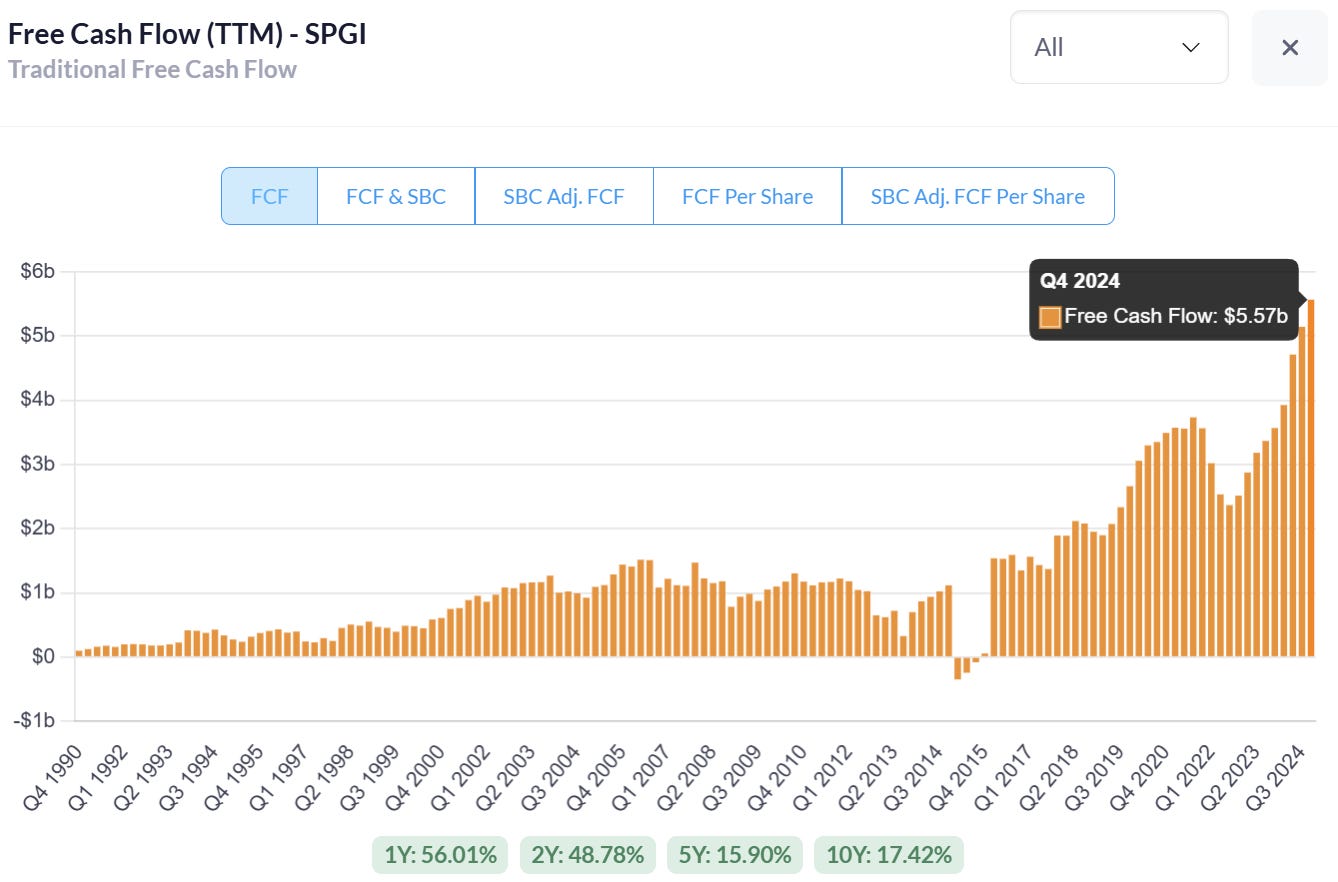
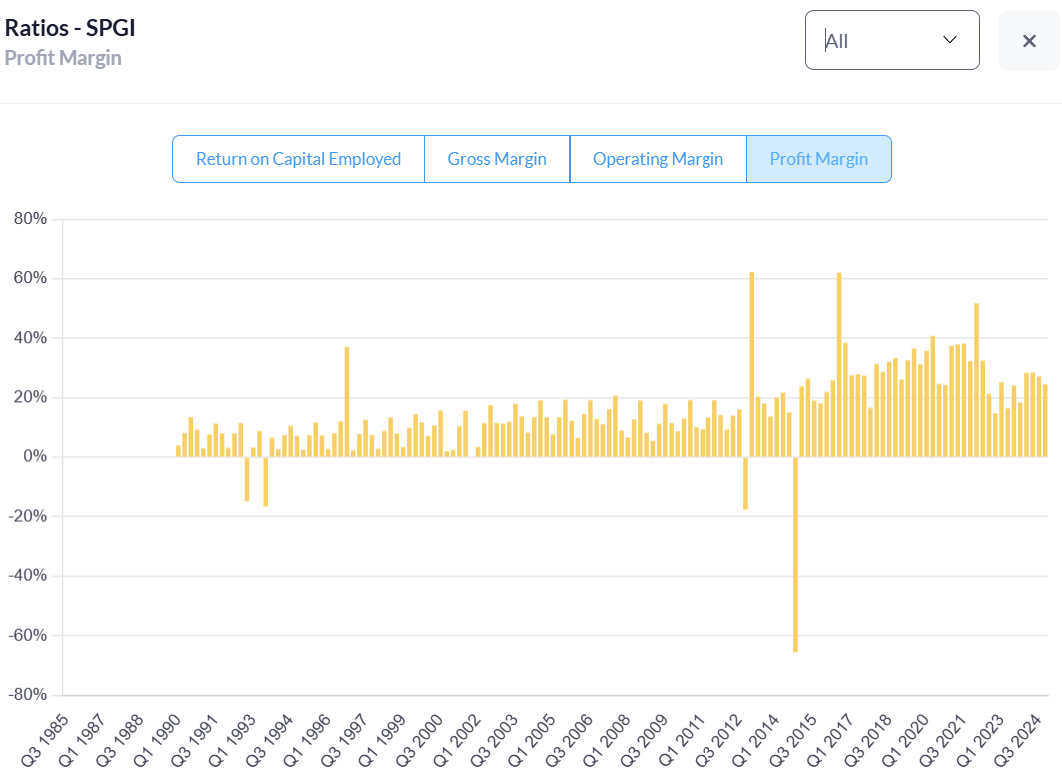
The company is truly an “essential” provider – its data and benchmarks are embedded in the plumbing of global finance. Whether it’s a corporation issuing a bond (which likely needs an S&P rating), an ETF tracking the S&P 500 index, or a bank managing risk with S&P’s analytics, S&P Global takes a cut. This has translated into consistent growth, fat profit margins (above 25%), and prodigious free cash flow, a picture says it all:
Over the past decade, S&P Global has delivered a total return of over 430% to shareholders, handily outpacing the broader market. The business model is asset-light (capex is minimal) and highly scalable – once data or ratings are produced, they can be sold repeatedly at little incremental cost.
S&P’s recent merger with IHS Markit (a $44B deal entirely financed with stock in February 2022) expanded its data empire further, adding fuel to its growth engine. The company has also been very shareholder-friendly, with 51 consecutive years of dividend increases and large buybacks (over $18 billion returned in the last 3 years via dividends and repurchases).
In short, SPGI offers a rare combination: a business that may not be thrilling, but one with a wide-moat franchise, big profit margins, strong secular tailwinds (the rise of data, passive investing, and the globalization of capital markets), and a track record of strong management execution— a formula for sustained earnings growth and return to shareholders.
1.3. Risks
Highly Competitive Environment: The Market Intelligence segment faces a highly competitive market with many players vying for market share. This competition has resulted in elevated price sensitivity, challenging the company to maintain its pricing power without compromising its value proposition.
SPGI faces strong competitors across its various segments:
Indices: MSCI.
Financial Data & Analytics: Bloomberg, Refinitiv.
A reputational hit from a ratings scandal, a disruptive technology, or acquisition integration issues could dent its growth trajectory.
Market-Driven Revenue Fluctuations/Cyclical Exposure: The Ratings and Indices divisions are significantly influenced by market conditions, leading to potential volatility in revenue. A downturn in market activity can adversely affect these divisions, impacting overall financial performance.
Approximately 25% of SPGI’s revenue comes from credit ratings, which fluctuate with debt issuance volumes.
A sharp downturn or credit freeze (e.g., 2008 financial crisis or a severe recession) can temporarily dry up bond issuance, hitting S&P’s ratings revenue hard.
In 2022, rising interest rates led to a global decline in debt issuance, causing a slump in S&P’s ratings segment.
Dependence on U.S. Economic Conditions: A substantial portion of S&P Global's revenue is tied to the U.S. market, making it vulnerable to shifts in U.S. economic and policy landscapes. Any unexpected economic challenges or policy changes could negatively impact revenue streams.
Exposure to Global Economic Uncertainty, Regulation & Competition: With operations spanning multiple geographic regions, S&P Global's financial performance is exposed to fluctuations and uncertainties in global economic conditions. This includes varying economic growth expectations and geopolitical risks in regions such as Europe and Asia.
Regulators, especially in Europe, have long expressed concerns about the dominance of the Big Three credit rating agencies.
Potential regulatory actions could encourage new entrants or limit reliance on agency ratings.
Integration and Synergy Realization: While the company has made significant acquisitions for growth, the successful integration and realization of anticipated synergies remain critical. This process carries risks of potential disruptions and integration challenges, which could impact operational efficiency and financial outcomes.
Valuation Risk:
SPGI trades at a (deserved) premium valuation compared to standard metrics (more on that later).
If growth slows or risks materialize, the downside could be amplified.
Despite these risks, S&P Global remains a resilient business with an entrenched market position and diversified revenue streams. The company’s long-term outlook remains strong, as its services are essential in global finance.
2. Business Model
2.1. History of the Company
S&P Global’s lineage can be traced back to McGraw-Hill, an educational publishing empire founded in 1888. Over time, McGraw-Hill expanded into financial information – notably acquiring Standard & Poor’s in 1966. Fast forward, and in 2016 the company rebranded as S&P Global after shedding non-core divisions. This marked a full transformation from textbook publisher to a pure-play data and analytics firm. A capstone of this transformation was the mega-merger with IHS Markit in 2022, a $44 billion deal, entirely financed with stock in February 2022, that further broadened S&P’s data offerings (spanning energy, automotive, economic forecasting, etc.).
Today, S&P Global Inc., together with its subsidiaries, provides credit ratings, benchmarks, analytics, and workflow solutions in the global capital, commodity, and automotive markets. It operates in six divisions: S&P Global Ratings, S&P Dow Jones Indices, S&P Global Commodity Insights, S&P Global Market Intelligence, S&P Global Mobility, and S&P Global Engineering Solutions. The S&P Global Ratings division operates as an independent provider of credit ratings, research, and analytics, offering investors and other market participants information, ratings, and benchmarks. The S&P Dow Jones Indices division is an index provider that maintains various valuation and index benchmarks for investment advisors, wealth managers, and institutional investors. The S&P Global Commodity Insights division offers data and insights for global energy and commodity markets and enable its customers to make decisions. The S&P Global Market Intelligence division delivers data and technology solutions for customers to provide insights for making decisions. It offers data and services that bring end-to-end workflow solutions, including capital formation, data and distribution, ESG and sustainability, leveraged loans, private markets, sector coverage, supply chain, and issuer solutions, as well as credit, risk, and regulatory solutions. The S&P Global Mobility division provides insights derived from unmatched automotive data, enabling its customers to anticipate change and make decisions.
As of December 31, 2024, we had approximately 42,350 permanent employees located worldwide, including around 24,450 in Asia, 11,200 in the U.S. and Canada, 5,700 in Europe, Middle East, and Africa, and 1,000 in Latin America.

S&P Global's workforce is heavily concentrated in Asia (58%), reflecting its operational efficiency and cost strategy, while U.S./Canada (26%) and EMEA (14%) remain key hubs. Latin America (2%) has minimal presence. This distribution highlights SPGI’s global reach and cost-conscious workforce allocation.

$SPGI's employee count remained relatively stable for decades, with gradual growth until 2021. The sharp increase post-2022 reflects the impact of its merger with IHS Markit, significantly expanding its workforce.
2.2. Key Concepts Regarding Its Business
S&P earns money through a mix of subscription fees, transaction-based fees, and asset-linked fees:
Subscriptions – e.g. annual licenses for Market Intelligence platforms, data feeds, Platts price reports, etc. This made up 52% of revenue in 2024.
Transaction/volume-based – e.g. fees for each new bond rating, or a fee per commodity contract using a Platts price. These vary with market activity.
Asset-Linked Fees – e.g. index licensing fees tied to AUM (Assets Under Management). S&P might earn a few basis points on the $trillions following its indices. They can fluctuate with market levels (if the S&P 500 goes up, so do the fees in dollar terms) but have a secular tailwind from investors pouring money into index funds.
Sales Usage-Based royalties – e.g. exchange trading volumes on S&P-based futures (S&P gets a cut of each trade’s fee).
Recurring variable – a hybrid category for contracts that have fixed and usage components (for example, a data contract with fees scaling by number of users).

The broad takeaway is that nearly three-quarters of S&P’s revenue is recurring or subscription-like. This lends excellent visibility. Even the more cyclical pieces (like ratings) have a recurring element: S&P charges annual surveillance fees to maintain ratings on outstanding debt. So, S&P’s business model is less volatile than it might seem from the outside.
Today, S&P Global’s mission is delivering “Essential Intelligence” across financial markets, and it does so via several key segments, let’s find out in the next chapter.
2.3. Revenue Analysis by Segments
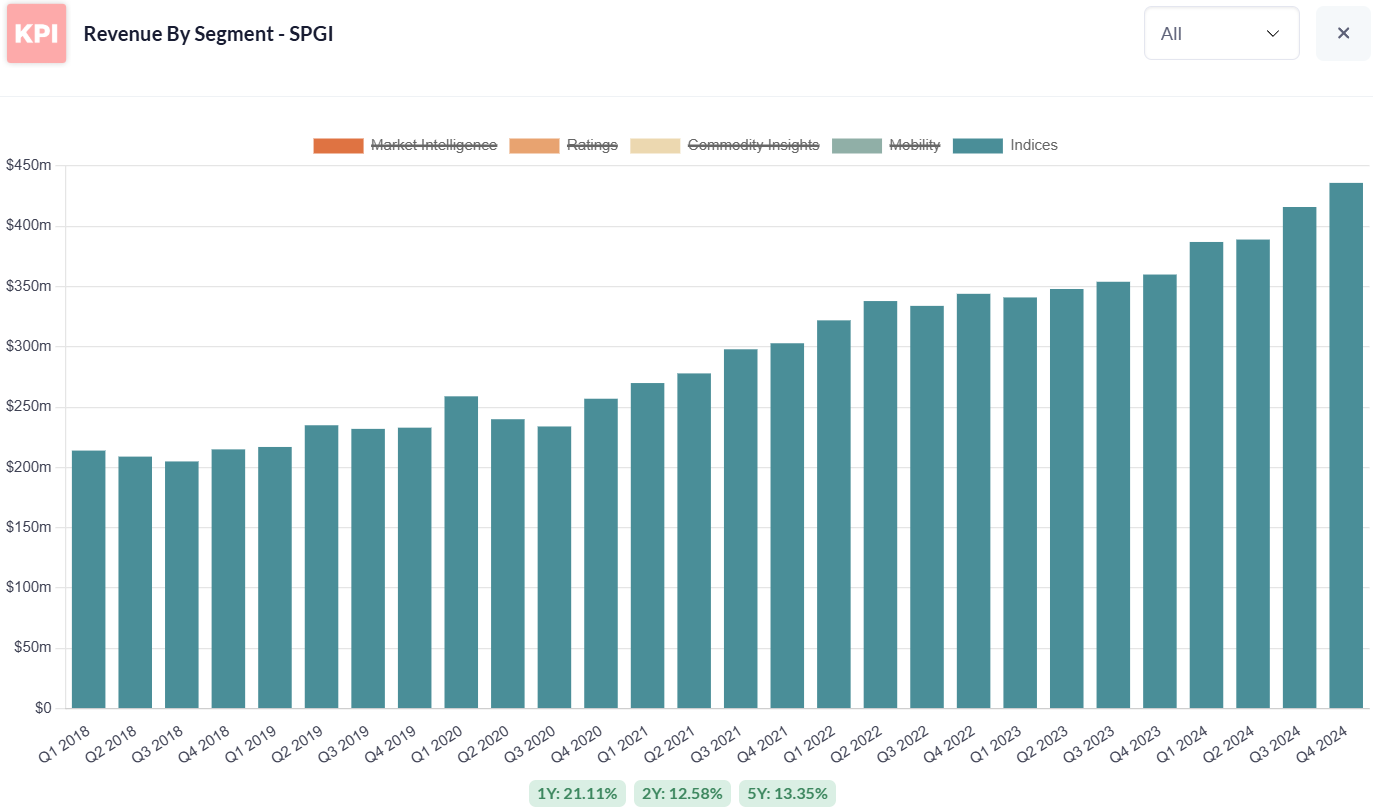
The graph shows S&P Global's (SPGI) revenue growth by segment from Q1 2018 to Q4 2024. Over this period, SPGI has exhibited strong, consistent revenue growth, with notable expansion in key business segments.
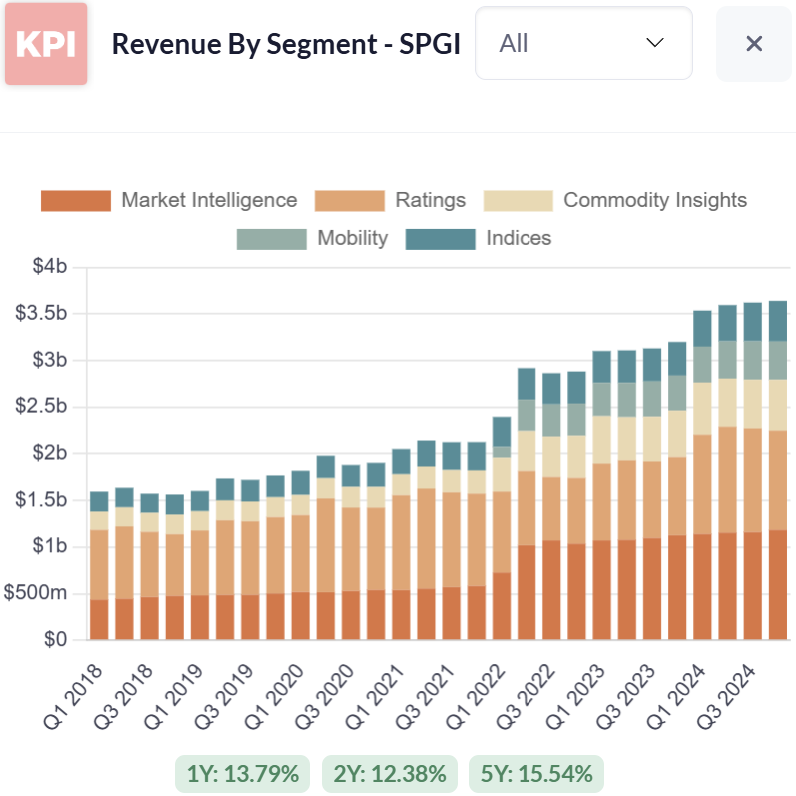
S&P Global Ratings: The credit ratings business is the direct descendant of Standard & Poor’s. It issues credit ratings for governments, corporations, and structured finance, helping investors gauge debt default risk. This is one of S&P’s oldest and most profitable units (and together with Moody’s, dominates the ratings field). In 2024, Ratings generated about $4.37 billion in revenue ( ~30% of total) with operating margins north of 60%. Clients (debt issuers) typically pay S&P for initial ratings and ongoing surveillance of outstanding bonds. This is the segment with the greatest cyclicality.

S&P Global Market Intelligence: Often referred to simply as Market Intelligence or MI, this segment offers a suite of data feeds, research, and analytics platforms (like S&P’s Capital IQ and LCD datasets). It caters to investment professionals, banks, and corporations who need financial data and analytics tools in their workflow. As shown in the next graph, the IHS Markit merger turbocharged this segment by adding breadth (from private company data to supply chain intelligence). Market Intelligence is S&P’s largest segment, contributing about $4.65B in 2024 revenue (~33% of total) through mostly subscription-based services. Think of it as S&P’s answer to Bloomberg/Refinitiv/FactSet – a one-stop information shop.

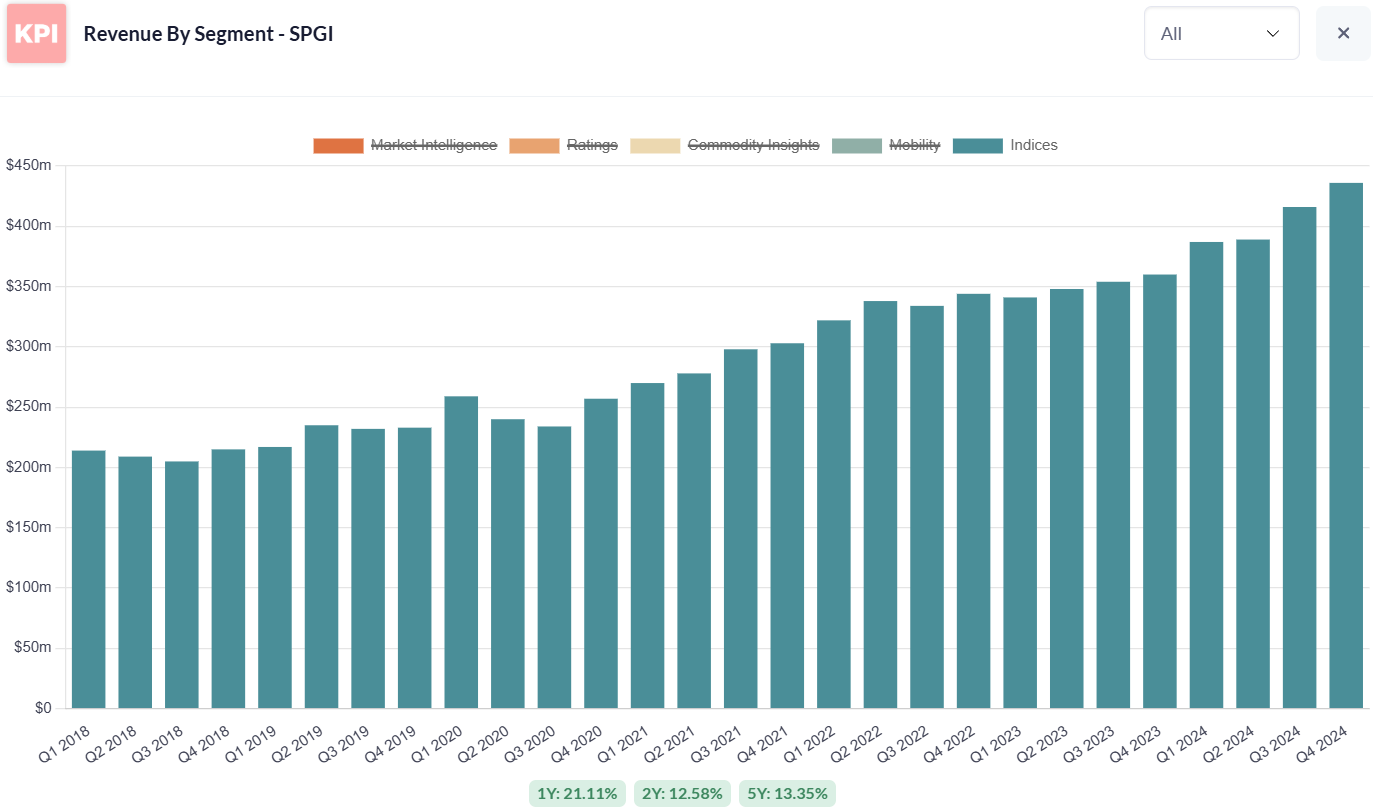
S&P Dow Jones Indices: This unit manages indices and benchmarks, including the iconic S&P 500 and Dow Jones Industrial Average. S&P Global is the majority owner (73%) of the S&P DJI joint venture. Indices generate revenue through licensing fees – e.g. ETF providers pay to use the S&P 500, futures exchanges pay to list contracts on S&P indices, and asset managers buy index level data. This is a phenomenally high-margin business (adj. operating margin ~69%). While Indices was ~11% of 2024 revenue (about $1.63B), it punches above its weight in profit contribution. It’s also growing steadily as passive investing continues to rise. To illustrate the dominance: an estimated $32.4 trillion in assets globally track S&P Dow Jones indices – with about $13.5T benchmarked just to the S&P 500. Each dollar in those funds generates a small licensing fee, adding up to a big annuity for SPGI. This is the fast growing segment.
S&P Global Commodity Insights: Formerly known as Platts, this segment provides commodity price benchmarks and analytics (for oil, natural gas, metals, etc.). Traders and industry players rely on Platts benchmarks (like Platts Brent crude price) to settle contracts. It’s akin to being the “S&P of oil prices.” Commodity Insights contributed roughly $2.1B in 2024 revenue (~15% of total), growing ~9.66% that year as global energy markets saw volatility (which often increases data demand). This business benefits from the must-have nature of benchmark prices – much like indices, it’s an information tollbooth for commodity markets.

S&P Global Mobility: A new segment carved out after the IHS Markit deal, Mobility offers automotive industry data and forecasts (IHS’s automotive database is a global standard for vehicle production, registration, and Carfax-like info). Mobility did ~$1.61B in 2024 sales. This unit connects S&P to automakers, suppliers, and dealers as clients. While smaller and lower margin than other segments, it adds diversification and cross-sell opportunities (for instance, tying credit ratings to auto-loan ABS (Asset-Backed Securities) data or commodities to electric vehicle materials demand).


Together, these five segments make S&P a well-diversified financial information empire. No single segment accounts for more than ~35% of revenue, which is a key strength. For example, during 2022’s bond issuance dip, S&P’s non-ratings units helped offset the decline. Indeed, only about one-third of S&P’s revenue comes directly from transactional, cyclical sources now; the rest is subscription or recurring in nature. As previous CEO Douglas Peterson put it once:
S&P provides “essential intelligence” that is often mission-critical for customers’ decision-making. This creates a sticky business with high renewal rates.
2.4. Capital allocation
Management has deployed capital shrewdly between growth investments and shareholder returns. The IHS Markit acquisition is a prime example – a bold move to fortify S&P’s data offering (Market Intelligence) and achieve cost synergies. S&P paid a rich price, but it was an all-stock deal, and integration has gone well (with cost synergy targets exceeded, hitting $619M run-rate by end of 2023). S&P also divested non-core assets like its low-margin Engineering Solutions unit in 2023 for $975M, demonstrating discipline in focusing on high-value segments. Excess cash flow has been returned aggressively to shareholders: in 2024 alone, S&P bought back $3.3B of stock and paid $1.15B in dividends.


Over 2018-2020 it also executed large buybacks, including a $12B accelerated repurchase in 2022 as part of the IHS deal. The dividend, while not high yield (~1% yield), has a 51-year streak of increases, reflecting a commitment to steady returns. Management balances growth and returns, targeting an efficient balance sheet without hoarding cash unnecessarily.
From the other hand, the business model is asset-light (Capex is minimal) and highly scalable – once data or ratings are produced, they can be sold repeatedly at little incremental cost.

The ROCE trend for S&P Global (SPGI) over the past decade shows strong historical capital efficiency but a notable decline post-2021. The company maintained double-digit ROCE levels for most of the period, peaking above 20% in 2016, reflecting its high-margin, asset-light business model.

However, ROCE dropped sharply after 2021, reaching near-zero levels in 2022-2023, likely due to the IHS Markit acquisition, integration costs, and increased capital deployment. While there is a slight recovery in early 2024, the lower returns indicate capital efficiency has not yet returned to historical norms.
2.5. Financial health
S&P Global’s financial profile is robust. The IHS merger did add substantial debt, but leverage remains moderate and cash flows are strong. As of end-2024, S&P had about $11.93 billion in long-term debt.

This is roughly 2x EBITDA – very manageable given S&P’s 39% operating margin and resilient cash generation. After only $124M in capex in 2024 (capex < 1% of revenue), free cash flow (FCF) was about $5.57B – easily covering dividends ($1.15B) and leaving billions for buybacks or debt paydown. S&P’s efficiency metrics are impressive too: return on equity is elevated by its high margins and asset-light model; and while debt is present, the interest on that debt is relatively low-cost (a lot of S&P’s debt is long-term notes in the 2–4% coupon range, much issued before rates rose). The company’s balance sheet does carry a large goodwill/intangibles load from acquisitions (total assets $60B vs equity $33B), but that’s expected in a roll-up of data businesses. The key is that those intangibles (data, brands, customer relationships) produce high cash returns. Every dollar of sales in 2024 produced nearly 39 cents of free cash flow (FCF margin ~39%), a strong efficiency indicator.
In summary, S&P Global’s business model is a fortress of recurring revenue and high margins. It has evolved from a pure ratings agency into a diversified financial information provider, reducing dependence on any single product. By smart capital moves (acquisitions, divestitures, buybacks) and maintaining financial discipline, management has positioned SPGI to both withstand economic cycles and capitalize on growth opportunities. Next, we’ll examine how this model translates into market share and competitive positioning in its key arenas.
3. Market Share and Industry Position
3.1. Company’s Dominance in Its Sector
S&P Global enjoys leading market share in several of its businesses – often by a wide margin. Its strongest moat is in credit ratings: S&P is #1 or #2 globally in nearly every major debt category. Alongside Moody’s, it effectively forms a duopoly in credit ratings, each holding roughly 40% of the global market (with Fitch a distant third around ~15%). In Europe, for instance, S&P alone had about 48.6% market share of all solicited ratings in 2023, with Moody’s at 31.5% and Fitch ~10%. This dominance has remained remarkably stable over decades – despite occasional newcomers, the “Big Three” still account for over 90% of ratings business. Such concentration speaks to high barriers to entry: credibility, track record, and regulatory acceptance take years to build. Issuers and investors trust S&P’s ratings as an impartial benchmark (even if they grumble about fees), and many regulations and contracts specifically require ratings from the big agencies. This is a textbook wide moat – entrenched by reputation and regulation. It would take a seismic shift (or regulatory fiat) to unseat S&P from its top-tier position in ratings.
Beyond ratings, S&P Dow Jones Indices is another crown jewel with outsized influence. The S&P 500 index is arguably the most important stock market index on the planet – as of early 2024, about $13.5 trillion in assets were benchmarked to the S&P 500 (of which ~$5.4T in indexed funds and the rest in active funds benchmarking performance). S&P Dow Jones Indices offers thousands of indices (S&P 500, Dow, S&P/TSX in Canada, etc.) and has a strong global footprint. It competes mainly with MSCI (well-known for international and ESG indices) and FTSE Russell (owned by London Stock Exchange Group). While exact market share is hard to pin down in indices, S&P is a leader especially in U.S. equities and commodities indices. For example, its S&P GSCI commodities index and Dow Jones indices are industry standards. The fact that over $32 trillion tracks S&P DJI indices globally underscores its leadership. This part of S&P’s empire benefits from a virtuous cycle – popular indices attract more investors, which in turn cements their status as “the index” to track for that market. It’s somewhat like being the de facto standard (think Windows OS in PCs or VISA in credit cards) – not easily disrupted.

In market data and analytics (Market Intelligence), S&P is a major player but in a more crowded field. Key competitors here include Bloomberg (privately held, the 800-lb gorilla of financial terminals), Refinitiv (now part of LSE Group, known for Eikon terminals and data feeds), FactSet, and Moody’s Analytics. S&P’s Capital IQ platform and datasets are highly regarded, but Bloomberg still has a lion’s share of front-office users. That said, Market Intelligence has niches of strength – for instance, S&P’s Leveraged Commentary & Data (LCD) service is a go-to for leveraged loan markets, and after absorbing IHS Markit, S&P now offers unique datasets (like Jane’s defense data, maritime & trade data, etc.) that many competitors lack. The total addressable market for financial data/analytics is large and growing – one estimate pegs the global financial analytics market at ~$9.7B in 2024, projected to reach $23B by 2032 (11.5% CAGR). S&P’s Market Intelligence is positioned to capture a good chunk of that growth, especially as the hunger for data in areas like ESG, private markets, and credit risk intensifies.
In commodity price data, S&P’s Platts (Commodity Insights) has a strong franchise, particularly in energy. Its main rival is Argus Media (private) and to some extent Bloomberg and ICE (Intercontinental Exchange) which provide energy price data too. Still, Platts is akin to the “Moody’s of Oil Prices” – deeply embedded. For example, Platts Brent is a leading benchmark for crude oil globally. The trends of energy transition and volatility can actually boost demand for data – more trading, hedging, and reporting = more need for trusted price benchmarks.
The new Mobility segment (auto data) faces competition such as J.D. Power or regional players, but IHS Markit was a leader in auto information, so S&P likely holds a top spot there as well. Additionally, S&P’s CRISIL subsidiary is a leading ratings agency in India, giving it a strong emerging market presence that Moody’s similarly has via its India affiliate (ICRA).
3.2. Market Trends and TAM
Total Addressable Market (TAM) & macro trends: S&P Global sits at the crossroads of several big-picture trends:
Rise of passive investing: The shift from active mutual funds to passive ETFs/index funds has massively benefited index providers like S&P. Every new ETF that tracks an S&P index is a recurring revenue stream. This trend still has room to run, including in international markets where passive penetration is lower. Translation: S&P’s index business should see steady asset-linked growth as global AUM in index funds rises.
Global debt growth (the “rated debt TAM”): Despite ups and downs, the long-term trajectory of global debt is upward – governments and companies continue to borrow. Outstanding global debt is measured in the hundreds of trillions of dollars. In particular, a “maturity wall” of corporate debt is looming mid-decade – with global debt maturities rising to ~$2.7 trillion by 2026, much of which will need refinancing (hence new ratings). S&P stands to gain from this wave of refinancing; indeed some analysts point out that the early-2020s issuance slump could lead to pent-up issuance later as companies can’t postpone refinancings forever. One report notes the high-yield and leveraged loan markets face a maturity wall of ~$475B in 2025 specially, which should spur ratings activity. In short, so long as borrowing needs persist, S&P’s ratings business has a growing TAM.
Data is the new oil (or gold): The financial world is awash in data, and organizations need help making sense of it – this underpins growth for Market Intelligence. New content areas like ESG (environmental, social, governance metrics), climate risk data, supply chain analytics, and private market valuations are expanding the scope of what firms like S&P can provide. S&P has even created a division (Sustainable1) focused on ESG data, which can tap into rising demand for sustainability metrics. As one Reuters piece noted:
“investors are increasingly spending more on analytics and data-related products… This trend bodes well for companies such as S&P Global”.
Digitalization & automation in finance: As financial institutions automate workflows, they often prefer to get data from established providers via feeds/APIs. S&P provides data through cloud APIs and feeds, meeting this need. Also, the complexity of financial markets (e.g., proliferation of derivative products, stress testing needs) drives demand for S&P’s risk analytics and models.
Emerging markets growth: As developing economies mature, they tend to both issue more debt (needing ratings) and see more investors (needing indices/analytics). S&P has a foothold in many emerging markets and can grow alongside them. For instance, local currency bond markets in Asia or Latin America are expanding and often these bonds eventually seek international ratings.
3.3. Competitors
We’ve touched on many rivals: Moody’s (MCO) is the closest peer – also a ratings agency turned data company. Moody’s is about half S&P’s size by revenue ($7B vs $14B in 2024 per estimates) and is more ratings-centric (53% of Moody’s revenue is from ratings, vs only 30% for S&P in 2024). Moody’s Analytics competes with S&P MI but is narrower (focusing on credit risk solutions, economics, etc.). MSCI Inc. ($2.2B revenue) is a heavyweight in equity indexing and ESG ratings, often competing with S&P on index contracts (e.g., for an institutional mandate to provide benchmarks). FactSet ($2B rev) competes in workstation and data feeds for investment professionals. Bloomberg (est. >$10B rev) is a fierce competitor in data terminals and also provides some indices (Bloomberg Barclays fixed income indices) and analytics – but Bloomberg is private and has a broad product slate beyond what S&P offers (like trading platforms). LSEG/Refinitiv ($7-8B financial data revenue) similarly is a big rival in data/analytics (and also owns FTSE Russell indices). In commodity pricing, aside from Argus, exchanges like CME and ICE have some market data services that compete at the edges.
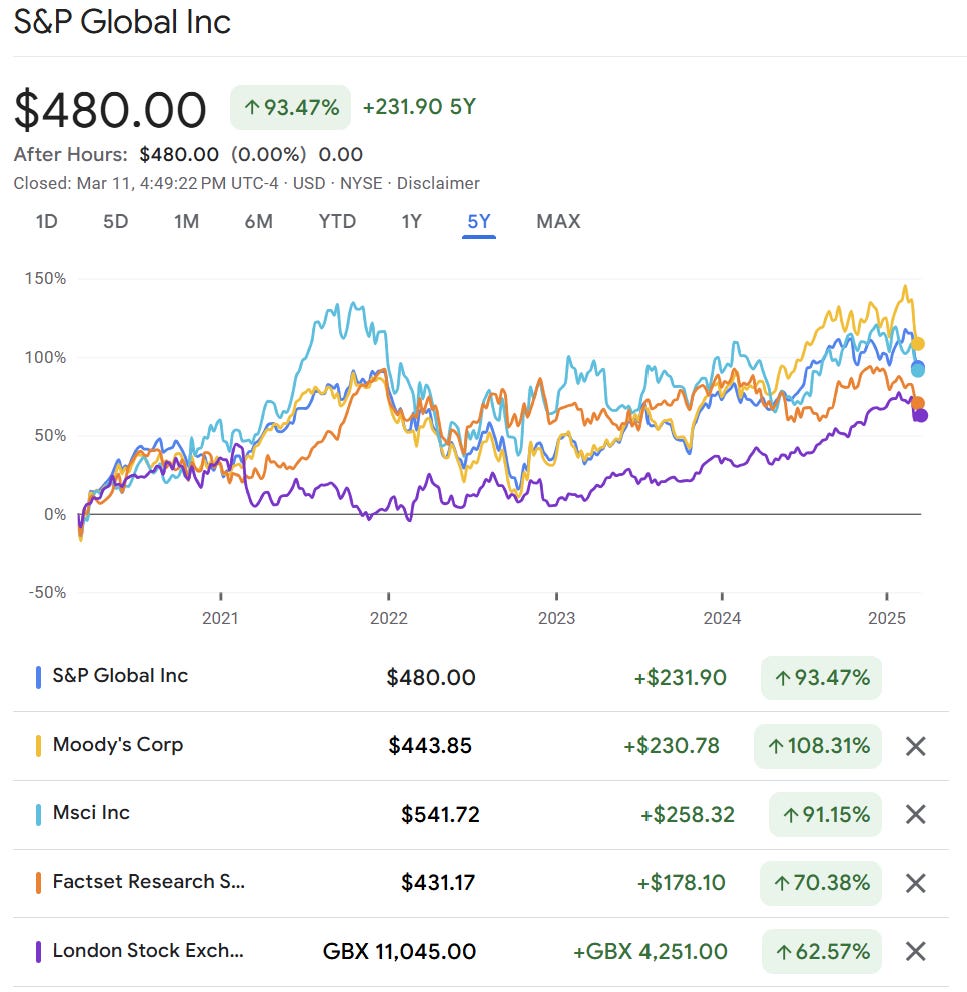
Over the past five years, S&P Global Inc. (SPGI) has delivered a +93.47% return, closely competing with Moody’s (+108.31%) and MSCI (+91.15%), while outperforming FactSet (+70.38%) and the London Stock Exchange Group (+62.57%). This highlights the strength of financial data and indexing businesses, which benefit from high-margin, recurring revenue streams. Despite market volatility, SPGI has remained a leader, leveraging its pricing power and essential role in financial markets. While Moody’s led in returns, SPGI’s diversified business model and dominance in indexing ($13.5T benchmarked to S&P 500) reinforce its long-term growth potential.
Despite formidable competitors, S&P often ranks #1 or #2 in each segment. And importantly, its breadth gives it an edge – it can cross-sell and bundle products (a client using Ratings might get a package deal on Market Intelligence, etc.). Competitors like MSCI or FactSet are more specialized, whereas S&P can say:
“we’ll handle your credit ratings, your index needs, your data feeds, and even your ESG analysis – an integrated solution.”
This breadth and scale (over $14B revenue, ~42,000 employees in 2024) make S&P a tough competitor to dislodge.

S&P Global ($SPGI) trades at a NTM P/E of 27.90x, lower than MSCI (31.98x) and Moody’s (31.57x) but higher than FactSet (24.81x) and LSE (27.14x). Its TEV/EBITDA (21.49x) is also slightly below MCO and MSCI, reflecting strong earnings power but not the highest valuation premium.

Over the past three years, SPGI’s NTM P/E averaged 29.62x, peaking at 35.16x and bottoming at 23.29x. Currently, it's at 27.90x, showing a valuation below its historical average. MSCI and MCO command higher multiples (31.98x & 31.57x, respectively), while FDS (24.81x) trades at a discount. The trend suggests SPGI remains a solid long-term play.

3.4. Growth Potential
Given its market positions, S&P Global has multiple growth levers:
Organic growth in each segment by gaining new customers and upselling new products (e.g., Market Intelligence launching new AI-driven analytics, Indices creating new thematic indices to license, Ratings expanding into unrated markets or new rating products).
Market growth: As discussed, secular trends like rising debt issuance, increasing ETF AUM, and data proliferation naturally expand the pie for S&P.
Global expansion: S&P can penetrate deeper into fast-growing regions (Asia-Pacific, Middle East). For instance, more Asian bonds getting international ratings or more local investors using S&P indices would grow revenue.
Innovation and new content: S&P is actively investing in technology (they acquired fintech Kensho for AI capabilities) to create new data-driven products. They are looking at things like integrating alternative data, machine learning analytics, etc., to stay ahead. New offerings in climate risk, supply chain (with their Panjiva trade data), or private markets could unlock new revenue streams.
M&A: While the IHS Markit integration is still recent, S&P could pursue bolt-on acquisitions in niche data areas (e.g., a cybersecurity risk ratings firm, or a regional rating agency) to bolster capabilities.
Overall, S&P’s dominance in core areas and presence in growth markets suggest it can continue to capture a substantial share of its TAM. It’s not resting on laurels either – management’s strategic vision (unveiled at Investor Day 2022) set medium-term targets for organic revenue growth and margin expansion, indicating confidence in further share gains and efficiency.
In summary, S&P Global is the 800-pound gorilla in credit ratings and a leader in indexes and financial data, with tailwinds at its back. Its diversification means it’s not overly reliant on one trend: if bond issuance is soft, maybe equity index licensing or commodity data picks up the slack, etc. The company’s wide moat market shares and integrated model give it a firm grip on its markets. Next, we turn to the people steering this ship – examining the quality of S&P’s management and governance.
4. Management Quality
4.1. Experience
S&P Global’s management team has a strong track record of value creation and execution. Until very recently, the company was led by Douglas L. Peterson, who served as CEO from 2013 until 2023. Under Peterson’s decade-long tenure, S&P’s stock price nearly quadrupled, thanks to savvy portfolio moves (like shedding McGraw-Hill Education and J.D. Power, acquiring SNL Financial and then IHS Markit) and consistent earnings growth. Peterson is often credited with transforming S&P into a modern data/analytics enterprise and instilling a disciplined, shareholder-friendly culture. In late 2024, Peterson announced his retirement, and S&P executed a smooth succession plan: Martina Cheung, a 14-year company veteran, took over as President & CEO effective Nov 1, 2024.

Ms. Cheung, prior to becoming President and Chief Executive Officer on November 1, 2024, was President, S&P Global Ratings since February 28, 2022, was President, S&P Global Market Intelligence since January 2, 2019, was Head of Risk Services for S&P Global Market Intelligence since September 2015, was Chief Strategy Officer for S&P Global since March 2014, and was Vice President of Operations for S&P Global Ratings since joining the Company in 2010.
Martina Cheung’s appointment is a positive sign for continuity. She is an insider with deep experience across S&P’s businesses – she previously led the Market Intelligence division, served as S&P’s Chief Strategy Officer, and most recently was President of S&P Global Ratings. In fact, as head of Ratings in 2023, Cheung oversaw a rebound in that unit to $3.3B revenue (up 9%), indicating her operational chops. By elevating someone who knows the company inside-out (rather than an outside hire), S&P’s board ensured the strategic course set by Peterson will largely continue. Peterson isn’t disappearing overnight either – he remains on the board until May 2025 and as an advisor through 2025, helping ensure a seamless transition. This kind of planned, orderly succession is often a hallmark of quality organizations.
Prior to joining S&P Global, Ms. Cheung worked for Accenture’s Financial Services Strategy group and later as a Partner at Mitchell Madison Consulting.
She was named one of the Most Powerful Women in Finance by American Banker and included on the list of Influential Women in Institutional Investing by Pensions & Investments in 2024. Also in 2024, INvolve named her to its 100 Empower Executives list for the second consecutive year. Ms. Cheung received the Merit Award from The Women's Bond Club in 2022. In addition, she was honored at the 2022 Ascend A-List Awards for advancing Pan-Asian professionals, and she was inducted into the Academy of Women Leaders by the YWCA New York City in 2016.
Ms. Cheung is a member of the Council on Foreign Relations, the Economic Club of New York, and served on the U.S. Commodity Futures Trading Commission’s (CFTC) subcommittee on Climate-Related Market Risk.
She serves on the Board of Trustees for Catholic Charities New York and was a member of the Board of CRISIL, a global analytics company and India’s leading credit ratings agency.
She holds a bachelor’s degree in commerce and a master’s degree in business studies from National University of Ireland, Galway.

Eric Aboaf as Chief Financial Officer, effective from February 2025. Mr. Aboaf joined S&P Global from State Street Corporation (NYSE: STT) where he served as the company's Chief Financial Officer for nearly eight years, as well as Vice Chairman since 2022. In these roles, he was responsible for the company's global financial strategy and finance functions, including treasury, accounting, tax, reporting, strategy and M&A, and investor relations. He also oversaw its Markets and Financing business. State Street Corporation is a leading financial services company for institutional investors with $44 trillion in assets under custody with approximately 53,000 employees worldwide.
Prior to his roles at State Street Corporation, Eric served as CFO for Citizens Financial Group, one of the largest regional banks in the United States, where he led all financial functions of the company with a focus on driving growth, expanding net interest margin, and leading efficient capital allocation programs. He also previously held senior financial roles during his twelve years with Citigroup, including as Treasurer where he managed the company's $1.9 trillion balance sheet. Earlier in his career, Eric was a partner at Bain & Company where he co-led the US financial services consulting practice and focused on growth strategy.
Eric graduated summa cum laude from The Wharton School, earned a master's degree from the Massachusetts Institute of Technology, and serves as Board Chair of the New York City Urban Debate League.
The table below show the management team:

The leadership team has a good balance of institutional knowledge and fresh perspectives (the IHS Markit merger also brought some new leaders into the fold).
4.2. Management Shares Ownership
S&P’s executives are aligned with shareholders primarily through stock-based compensation and share ownership. Insider ownership stands at around 1% of shares (about 3.3 million shares held by insiders). While not huge, at S&P’s current market cap that’s ~$1.5 billion worth – certainly enough to keep management’s interests tied to the stock’s performance. Former CEO Peterson himself held a significant number of shares and regularly sold some as part of diversification (e.g., a ~$3.4M sale in Aug 2024), which is normal for a CEO after years of accumulation. New CEO Martina Cheung, from her most recent SEC Form 4 filing from 4th March 2025, acquired shares through performance-based awards and sold shares to cover tax obligations, owning 17,203 shares of common stock plus various RSUs (Restricted Stock Units) that will vest over time, making a significant amount compared with her salary (11x times her 2024’s salary in today’s share prices).

Moreover, S&P’s executive compensation includes performance metrics like revenue growth, adjusted EPS, and return on invested capital, incentivizing leaders to drive sustainable financial results. Importantly, S&P has not been known for excessive pay or egregious perks – its proxy statements show a fairly standard large-cap pay structure.
The following table shows the number of shares of the Company’s common stock beneficially owned on March 7, 2024 by each of its Directors and Director nominees; the Chief Executive Officer and the other four named executive officers; and all individuals who served as Directors or executive officers at March 7, 2024, as a group:

As evident from the table, former CEO Douglas L. Peterson held a substantial $80 million stake in SPGI stock, highlighting his strong financial commitment to the company.
The following table shows information as to any person known to the Company to be the beneficial owner of more than 5% of the Company’s common stock on the date indicated below:

These positions reinforce SPGI’s status as a core holding in major index and passive investment strategies, given its dominance in financial data, credit ratings, and indexing services. The strong presence of these asset managers suggests long-term stability, though it also means a large portion of SPGI's ownership is tied to passive funds rather than active investors.
Recent insider activity at S&P Global (SPGI) shows a clear trend of selling among top executives. The third quarter of 2024 saw the highest level of insider selling, with over 60,000 net shares sold. Key executives, including Saugata Saha (President, Market Intelligence) and Martina Cheung (President, S&P Global Ratings), consistently reduced their positions at prices between $480-$523 per share.

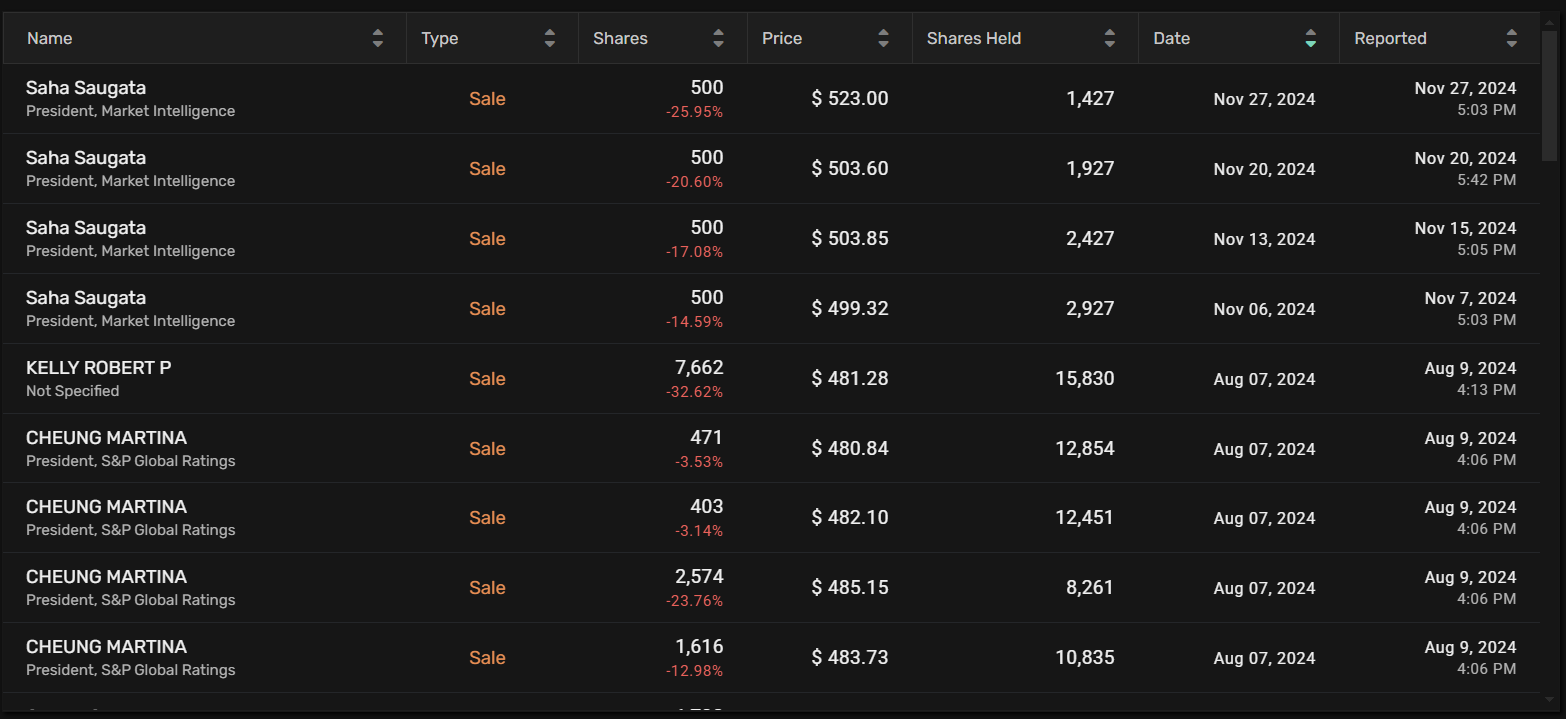

This heavy selling coincided with SPGI’s stock rising 15.75% between July and September 2024, suggesting insiders took profits at relatively high valuations. Furthermore, SPGI’s P/E ratio was around 42.31 in early July, a historically high level, reinforcing the likelihood that insiders viewed the stock as overvalued at that time.

Since then, valuation has moderated, with the stock currently trading at a P/E of 27.90x, aligning closer to historical norms.
4.3. Executive’s Compensation
Base salary is a customary, fixed element of compensation intended to attract and retain key executive talent.
The following table contains information concerning compensation paid or accrued to the named executive officers for services rendered in all capacities to the Company in 2023, 2022 and 2021:
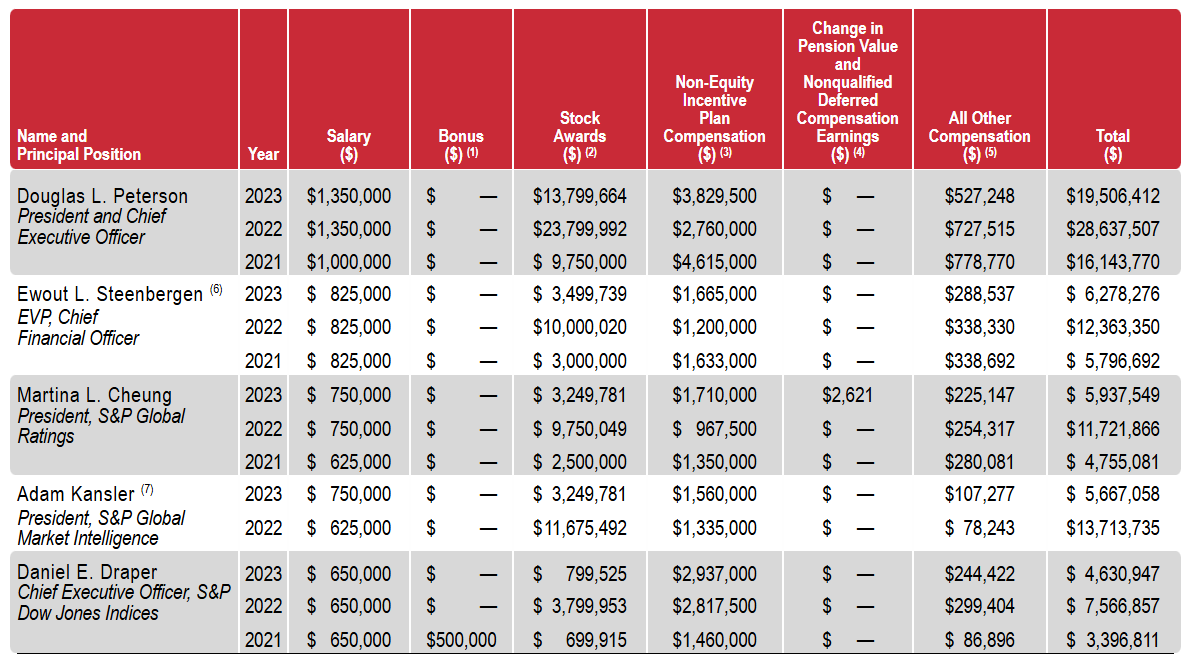
While base salaries remain relatively stable, stock grants and non-equity incentives vary based on company performance, reinforcing a strong pay-for-performance culture.
4.4. Shareholder Treatment
As mentioned, S&P has a stellar record of returning capital. Management hiked the dividend every year for over five decades, even during downturns. The dividend per share is modest (~$3.64 annual in 2024, a ~0.8% yield at current prices), but it signals confidence in steady cash flows. Buybacks have been opportunistic but sizable – e.g., executing a $2.5B repurchase in 2022 when the stock dipped, and additional ASR (accelerated share repurchase) programs in 2023 totaling over $3B, same amount for 2024.


In fact, over the 2021-2024 period, S&P repurchased ~$19.5B of stock and paid $4B in dividends. That’s an enormous $23B+ returned to shareholders, made possible by both cash generation and the issuance of stock to fund the IHS deal (which they’ve been partially clawing back via buybacks). The willingness to buy back shares (even as the stock isn’t “cheap”) reflects management’s view that investing in their own business is high-return, a bullish sign.


Strategic decisions: Several recent decisions demonstrate management’s quality:
The IHS Markit merger – a bold bet that has thus far been executed well. S&P integrated a company of similar size and hit synergy targets early. It required significant planning and cultural integration, which management handled without major hiccups (no disastrous customer or talent loss). The merger positioned S&P ahead of Moody’s in diversification – as one analysis noted,
“S&P’s revenue exceeded $14B in 2024 with Ratings only 34%, whereas Moody’s $7B is 53% Ratings – S&P’s breadth offers protection”.
This was the vision management sold to investors, and it’s playing out.
The sale of Engineering Solutions – this was a low-growth, lower-margin unit from IHS Markit (providing engineering standards and technical info). Management swiftly identified it as non-core and divested it in 2023, even taking an $120M accounting loss on sale. The decision removed a drag on margins (that segment had only ~15% op margin) and freed up capital. It shows a willingness to cut clutter and focus on strengths.
Investment in technology and innovation – S&P’s purchase of Kensho (2018), an AI analytics firm, signaled that management eyes the future. Kensho has been integrated to enhance S&P’s data analytics (e.g., AI tools for parsing financial documents). They’ve also launched new products like “Marketplace” (an online store for datasets) and partnered with startups. This suggests management isn’t resting on legacy laurels; they are trying to future-proof the company.
Risk management: The company navigated the pandemic and 2020 market tumult adeptly – Ratings had a boom (lots of refinancing in low rates) while Indices saw some AUM dip with the market, but overall S&P emerged stronger. They managed expenses tightly when needed (in 2020 they did some cost cuts to protect margins). Also, S&P has avoided major scandal since the 2011 mortgage ratings settlement – it’s been proactive in compliance and adjusting business practices post-2008. This speaks to a responsible culture where lessons were learned and issues addressed (contrast to, say, Wells Fargo’s management stumbles in banking).
Board and governance: S&P’s board of directors includes experienced figures from finance and industry, providing oversight. The board authorized big moves like IHS Markit after presumably rigorous review. They also likely helped orchestrate the CEO succession. One item of note: S&P’s ownership structure is straightforward (one share, one vote; no controlling shareholder). Major holders are diversified institutions (the Vanguard, BlackRock, etc. owning ~27% combined). This means management is accountable to a broad base of investors and cannot easily entrench themselves contrary to shareholder interests.
In terms of recent strategic positives: Achieving merger synergies early, divesting non-core assets, and maintaining growth momentum even in a challenging 2022 are all feathers in management’s cap. For example, at the December 2022 Investor Day, the team laid out ambitious targets (like mid-single-digit organic revenue growth, mid-40s% adjusted margins) and in 2023 they delivered at the high end of guidance. They even increased the pace of innovation in AI, private markets, etc., according to Peterson’s parting remarks.
It’s also worth noting S&P’s culture tends to be collaborative and research-driven – many employees are analysts, data scientists, etc. The ability to keep such talent is crucial. Management has cited initiatives to attract and retain talent, and as of now, there haven’t been news of talent exodus. New CEO Cheung herself coming from within likely inspires confidence among staff who know her leadership style.
In summary, S&P Global’s management ranks high on quality: they are experienced, aligned with shareholders, and have a record of making savvy strategic moves. Shareholders have been treated well under their watch. The transition to Martina Cheung is a key development, but given her background and the continuity of strategy, we have reason to expect S&P will remain in capable hands. As we evaluate S&P as an investment, this strong management underpins the credibility of the growth and efficiency targets that make the bullish case.
5. Competitive Advantages (Moat)
S&P Global’s business is protected by several durable competitive advantages that give it a wide economic moat. These include:
Regulatory Embeddedness: S&P’s products are woven into regulations and contracts worldwide. Many financial regulations (Basel bank rules, SEC rules, insurance company capital requirements) specifically mention ratings by NRSROs (nationally recognized statistical rating organizations) – of which S&P is one. This means banks and insurers must use S&P (or Moody’s/Fitch) ratings to comply with rules on credit risk. New agencies struggle to attain such recognition. On the index side, many mutual fund prospectuses or ETFs explicitly track S&P indices. Changing an index is non-trivial and could even trigger taxable events for funds. This “baked in” status gives S&P an incumbency advantage.
High Switching Costs: S&P’s customers face meaningful costs or frictions to switch providers. For example, if an issuer has a long-standing S&P rating on its bonds, dropping it could alienate investors or require a re-evaluation. In Market Intelligence, once analysts get used to CapIQ or S&P’s data feeds integrated into their models, switching to a competitor might involve retraining staff, reconciling data differences, and even losing historical continuity. Index switching is particularly rare – for an ETF with billions in AUM to change its underlying index provider would be operationally complex and could affect tracking error. These switching costs create a sticky customer base. It’s notable that S&P’s retention rates on subscription products are very high (often in the mid-90% range, per company reports), reflecting these frictions and the value customers derive.
Network Effects: There’s a subtle network effect in S&P’s businesses. In ratings, the more issuers that use S&P, the more investors rely on S&P-rated bonds (because they want to compare apples-to-apples). Thus investors might demand an S&P rating as part of due diligence. In indices, the more popular an index becomes, the more products track it (further entrenching its popularity). The S&P 500’s broad adoption leads to more liquidity in S&P 500 futures/options and ETFs, which in turn makes the index even more useful and “core” to the market. This self-reinforcing loop makes it exceedingly hard for an upstart index provider to displace S&P’s flagship indices.
Economies of Scale: S&P operates at a scale few can match, allowing it to spread costs over a huge revenue base. Developing a new risk model or maintaining a global analyst team for ratings is expensive; S&P can amortize those fixed costs across thousands of customers. Smaller rivals can’t economically justify the breadth or depth of coverage S&P has. Scale also helps in negotiating data sourcing (S&P can get data cheaper or exclusively) and in distribution (its salesforce can cross-sell multiple products). S&P’s operating margins (~39% in 2024) are evidence of scale efficiencies. Scale also matters in technology – S&P can invest hundreds of millions in IT (cloud, AI, cybersecurity) that smaller competitors might struggle to match.
Proprietary Data & Content: Over decades, S&P has amassed unique databases and intellectual property. For example, their historical database of corporate defaults and ratings transitions is unmatched – this is invaluable for credit risk modeling. Platts has proprietary pricing methodologies and datasets for commodities. The indices business has IP in index construction. Sustainable1 has proprietary ESG scoring models. These proprietary assets give S&P content that either can’t be obtained elsewhere or is considered the market standard. If a competitor wanted to replicate, say, 50 years of S&P default data, they simply couldn’t – it has to be built over time. S&P’s acquisition strategy (like buying IHS) also focused on grabbing unique content sets (like Jane’s defence data, or Carfax vehicle data, etc.). All this content is an economic moat – customers often come specifically for that data.
Integrated Solutions (Breadth): S&P’s span of offerings allows it to bundle solutions in a way competitors with only one line cannot. For instance, a regional bank could get its bond rated by S&P, subscribe to S&P’s credit analysis software, and license an index for its investment products – a one-stop shop. This breadth can create a one-stop ecosystem that increases customer dependency. Moody’s is trying something similar (with Moody’s Analytics), but S&P’s coverage from commodity prices to equities to fixed income is broader. The cross-segment knowledge can also spur innovation – e.g., combining data from Ratings and Market Intelligence to create new credit risk indicators.
Human Capital & Expertise: S&P employs thousands of analysts and subject-matter experts. Its credit analysts, index committee members, economists, etc., are often industry veterans. This deep expertise is itself a moat – the “analytical know-how” and judgment built over years is hard to replicate. Many of S&P’s methodologies and criteria are public, but applying them consistently and globally requires institutional knowledge. This is why we don’t see hordes of successful new rating agencies; it’s not just about formulas, it’s also about expert judgment (S&P’s rating committee process) and credibility. S&P has built that institutional expert network, and it’s a competitive advantage to have the best minds in credit risk and data science on your team.
All these advantages translate into S&P being able to earn high returns on capital and fend off competition. It’s telling that despite being in information services (which theoretically have low physical barriers), S&P and Moody’s have enjoyed oligopoly status for so long. The moat shows in metrics like profit margins and pricing power – S&P is able to regularly implement price increases on subscriptions and rating fees without losing business, indicating customers see no easy substitute.
A quick comparison with a peer, Moody’s: Moody’s shares many moats (brand, regulatory capture in ratings), but S&P arguably has a wider diversification moat. Moody’s is strong in credit ratings and has a growing analytics arm, but S&P’s multi-segment model means it has more touchpoints with clients. For example,
“S&P’s diversification offers protection, while Moody’s concentration yields more volatility”.
This diversification itself is a competitive edge – it smooths results and allows cross-subsidization/investment where needed.
In short, S&P Global’s competitive advantages are solidly entrenched. It would require extraordinary circumstances (e.g., a regulatory overhaul eliminating the use of ratings, or a technological revolution that commoditizes data completely) to significantly erode these moats. Even then, S&P is innovating and adapting to maintain its edge. The presence of these moats is a core reason the investment thesis is attractive – they underpin S&P’s ability to sustain high performance long into the future.
6. Risk Factors and SWOT Analysis
While S&P Global is a high-quality business, investors should be keenly aware of the risk factors that could threaten its success or the stock’s performance. Below we outline key risks across various dimensions, along with mitigation strategies where applicable, followed by a SWOT summary.
6.1. Long-Term Risks (5-10 Years)
Regulatory/Anti-Trust Action: Given S&P’s dominance, regulators might attempt to curtail its influence. The EU, for instance, has periodically mused about reducing reliance on big rating agencies. In a worst-case scenario, regulations could change such that banks no longer need external ratings, or governments create official rating agencies. Similarly, antitrust regulators could scrutinize the index business (there have been questions about index providers’ high fees). Mitigation: S&P engages actively with regulators and has improved transparency in methodologies post-2008. It’s also diversified so that it’s not just a “rating agency” – that broader role may make it less of a target. Nonetheless, regulatory risk is hard to eliminate; close monitoring of policy developments is warranted.
Disintermediation by Technology: The rise of AI and alternative data could, in theory, provide new ways to assess credit risk or create indices without traditional firms. For example, some fintech or big tech could develop AI models that predict default risk from unconventional data, potentially bypassing traditional ratings. Or decentralized finance could create on-chain credit scoring. While this risk seems remote now (given trust and regulatory constraints), over a 5-10 year period technology can surprise. Mitigation: S&P is investing in AI (via Kensho) to ensure it remains at the cutting edge. Also, S&P’s data trove can fuel better AI models than most new players could manage – i.e., it can use tech as an opportunity rather than threat.
Market Structure Changes: If capital markets shift in unforeseen ways, S&P could be impacted. For example, if companies rely less on public debt markets (thus fewer bonds to rate) and more on private lending or crowdfunding, that could reduce ratings volume. Or if active investment makes a big comeback at the expense of passive, index licensing might plateau. Another scenario: consolidation of asset managers could give a few giant clients bargaining power to push down index/data fees. Mitigation: S&P is expanding into private markets data, ESG, and services that cater to active managers too (it’s not purely riding the passive wave). Also, as more investment flows to quant strategies, even active managers use index components and data feeds, so S&P can adapt offerings.
6.2. Business-Specific Risks
Cyclical Volatility in Ratings: The credit ratings business is cyclical. In downturns or when interest rates spike, debt issuance can plummet (as seen in 2022 when high-yield issuance froze, hurting S&P’s transaction revenue). If we enter a recession, new bond sales may slow and even some defaults could occur (though S&P gets paid for ratings surveillance, defaults could cut that short and also hurt the perceived value of ratings if misses occur). Even outside recessions, issuance is lumpy – e.g., many companies pulled forward borrowing to 2020-21 at low rates, leading to a quieter 2022. This “feast or famine” pattern can cause earnings swings for S&P. Mitigation: S&P has diversified revenue streams to weather these swings – in 2023, non-ratings segments grew and helped offset rating softness. Additionally, a lot of S&P’s ratings revenue is recurring (surveillance fees), which cushions downside. S&P also manages costs in lean times (e.g., slowing hiring) to preserve margins.
Event Risk / Quality Control: S&P must maintain trust in its ratings and indices. A major misstep – for instance, if S&P failed to downgrade a company that then defaulted abruptly, or made an error in index calculation – could damage its reputation or lead to lawsuits. In 2015, S&P settled a $1.5B DOJ lawsuit for pre-2008 mortgage ratings. Another such event is a risk. There’s also legal risk: ratings agencies periodically face litigation from disgruntled issuers or investors (though they have some First Amendment protection in the US). Mitigation: S&P has strengthened its analytics and governance processes (e.g., internal controls, independent risk committees). It also carries professional liability insurance and has legal teams to manage litigation.
Competition in Data/Analytics: While S&P has a strong position, the market intelligence space is competitive. Bloomberg in particular is a fierce competitor with sticky customers. If Bloomberg, FactSet, or others introduce better products or aggressive pricing, S&P could lose share or face margin pressure in Market Intelligence. Similarly, MSCI or Morningstar could encroach in ESG or index offerings, and new competitors like Snowflake’s data marketplace or Sentiment traders providing alt-data might nibble at the edges. Mitigation: S&P continuously enhances its platforms (the new Capital IQ Pro platform integrates CapIQ and IHS Markit’s datasets). Also, bundling multiple services can deter clients from switching to niche competitors. S&P’s broad content is a natural moat against one-trick competitors.
Execution Risk on Integrations: The IHS Markit integration is ongoing. While largely successful so far, large integrations can hit snags – cultural integration issues, systems integration delays, or not achieving expected revenue synergies. There’s a risk some IHS businesses underperform or clients churn due to the merger. Mitigation: Given a couple years since the merger (closed Feb 2022), most integration heavy-lifting has been done, and cost synergies exceeded plan. The remaining risk is achieving “revenue synergies” (cross-selling, new products combining expertise), which are harder to measure but any shortfall there would likely just mean upside not fully realized, rather than core business harm.
6.3. Financial Risks
Leverage and Interest Rate Risk: Post-merger, S&P’s debt load rose. While manageable now, if interest rates remain high or rise further, S&P’s future refinancing of that ~$11.4B debt could be at higher rates, eating into earnings. Also, having debt limits flexibility – in a severe downturn, high fixed interest costs could stress cash flow (though S&P’s interest coverage is strong at present). Mitigation: S&P has laddered maturities (only $47M due in 2024, then small in 2025-26, major chunks not until 2027+) and much of its debt is at fixed low coupons locked in prior to 2022. Its debt/EBITDA is modest and it can temporarily pause buybacks to prioritize debt paydown if needed (it did slow buybacks in 2022 during the merger process). The company’s covenant of 4x cash flow is far from breached. And S&P’s cash flows are resilient and largely uncorrelated with inflation, which helps in a high-rate environment.
Foreign Exchange Risk: ~40% of S&P’s revenue is international. A strong dollar can reduce reported revenue and profit from those regions. S&P does have costs abroad as well, which naturally hedges some exposure, but FX swings can still impact results. Mitigation: S&P doesn’t hedge FX on an operating basis typically, but investors can look at constant-currency growth (which S&P reports) to gauge underlying performance. Over time, currency effects tend to even out, and S&P’s geographic spread is fairly diversified (Europe ~23% of rev, Asia ~11%, etc.
Acquisition/Integration Risk: If S&P continues to make acquisitions, there’s always risk of overpaying or mis-integrating. The IHS deal raised some investor eyebrows at the price (44B!). If any large future M&A is attempted, that could introduce uncertainty or require issuing stock (dilution) or debt. Mitigation: Management has stated they’re focused on integrating IHS now; any new deals likely would be smaller tuck-ins. They have shown discipline in divesting what doesn’t fit, which gives some confidence they wouldn’t hang onto a bad acquisition indefinitely.
6.4. Macroeconomic Risks
Recession or Credit Crisis: In a severe global recession, S&P’s businesses could face a double whammy – reduced ratings revenue (less issuance, possibly more defaults meaning fewer outstanding bonds to surveil) and lower index fees (if equity markets drop significantly, the asset-linked fees fall). For instance, if 2020’s COVID shock had not been met with Fed support, we could have seen a barren issuance market for longer. Additionally, in a recession, clients might trim discretionary spending on data/analytics (though one could argue data is mission-critical and not the first thing cut). Mitigation: As 2020 showed, even during turmoil S&P remained profitable and actually benefited from a rush of refinancing. The diversified model is a natural hedge: when rates go low in recessions, issuance often increases (companies refinancing), and central bank actions can spur equity rebounds (helping indices). Nevertheless, a sharp market value decline (say a prolonged bear market) would dent some revenue lines. S&P maintains healthy margins that could compress to absorb some revenue hit while remaining in strong positive earnings. Its balance sheet can withstand a downturn given interest cover and lack of near-term debt maturities.
Inflation and Cost Pressures: High inflation could increase S&P’s cost base (salaries for its thousands of skilled employees, data center costs, etc.). If not managed, this could squeeze margins. S&P does have pricing power to raise fees annually, but those usually track inflation modestly. Mitigation: S&P has been investing in automation and offshoring some functions to manage costs. Also, much of its cost is human capital – which historically has inflation roughly in line with general CPI. S&P’s high margins give cushion to maintain investments in talent without jeopardizing overall profitability too much. The company delivered ~46% adj. op margin in 2023 even as it absorbed wage inflation, showing ability to adapt.
6.5. SWOT Analysis
Strengths: A globally recognized brand with near-monopoly status in key areas (ratings, major indices). Highly diversified yet synergistic business lines. Strong recurring revenue and cash flow generation. Exceptional profit margins and return on capital. Scalable, asset-light model. Wide moat from reputation, regulatory integration, and proprietary data. Long track record of growth and shareholder returns. Experienced management and effective execution on strategy.
Weaknesses: Some reliance on cyclical capital markets activity (especially debt issuance). High margin business could attract scrutiny or new entrants (everyone would love to chip away at a 70% margin index business – though few can). The company’s size and complexity (after IHS merger, 40k+ employees) could make agility an issue. Also, arguably S&P’s valuation is a weakness – the stock’s premium means the company must continue firing on all cylinders to justify it (not an operational weakness, but a consideration for investors). Finally, while diversified, S&P is still essentially tied to the financial industry’s fortunes – it’s not producing something like consumer staples that are truly economy-agnostic.
Opportunities: Plenty of avenues for growth: new products (e.g., ESG ratings, climate risk analysis, supply chain data – all growing needs), further global expansion (emerging market debt and investment growth), upselling integrated solutions to clients (e.g., combining ratings, data, and software in one package). The refinancing “maturity wall” of mid-2020s debt is a near-term opportunity that could drive a surge in ratings business. Also, technological advancements like AI can be an opportunity – S&P can use AI to improve efficiency (perhaps automating parts of analysis) or to create new analytic products that make use of its vast data lakes. M&A could also be an opportunity if done smartly – there are still niches (like wealth management data, or certain emerging market coverage) where acquisitions could enhance S&P’s portfolio.
Threats: Competition nibbling at parts of the business (e.g., if a competitor dramatically undercuts pricing on index fees or a government-sponsored rating agency arises). Regulatory changes remain an ever-present threat – e.g., the SEC or EU could impose new rules on rating agency fee models or liability. Disruptive innovation is a threat, however minor it seems now – perhaps a decentralized finance platform enabling peer-to-peer credit scoring, or an open-source alternative to index provision (some have suggested markets could use public indices to avoid fees). Also, macro threats: prolonged stagflation or a credit crisis could stress the business in multiple ways simultaneously.
In weighing these, many risks (especially cyclical ones) are about timing and degree – they can cause short-term setbacks or volatility but don’t necessarily break the long-term thesis. The more concerning would be structural shifts (like regulatory changes that disfavor S&P’s role) – those are less likely but would have bigger impact. The company has thus far shown agility in mitigating risks: diversifying to handle cyclicality, engaging with regulators to avoid draconian measures, and innovating to stave off disruption.
6.6. Mitigation strategies
S&P’s best defense is its diversification and proactive adaptation. By not being just a one-trick pony, it naturally hedges some risks (indices offset some ratings swings, etc.). The company also keeps a conservative financial posture, so it can weather storms without distress. For competition, S&P often partners where it makes sense (for instance, S&P DJI is a JV with CME and News Corp – turning potential competitors into partners). It also invests heavily in quality – the best way to fend off threats is to remain the premier provider such that customers prefer you even if alternatives exist (we see this in Bloomberg vs others; S&P strives for that level of indispensability in its domains).
In conclusion, the risk profile of S&P Global is manageable for a long-term investor but not negligible. The company is not immune to economic cycles or regulatory whims, and the stock’s valuation could magnify the impact of any stumble. However, the combination of S&P’s entrenched moat and prudent management gives confidence that most risks can be mitigated or absorbed. Investors should keep an eye on issuance trends, regulatory signals (especially from Europe), and competitive moves, but as of now S&P’s strengths outweigh its weaknesses.
7. Financials Deep Dive
Turning to the numbers, S&P Global’s financial profile is characterized by strong growth, high margins, and solid balance sheet management. Here we dissect key financial metrics, recent performance, and compare S&P to peers.
7.1. Debt Levels
Debt and leverage: As discussed, long-term debt is about $11.93B. The debt-to-EBITDA ratio is around ~2.14x (if using 2024 EBITDA of $5.58B which includes adding back amortization and some one-offs).

S&P carries investment-grade credit ratings itself (rated around A/A- by agencies). Debt maturities are staggered, with the biggest chunk ($8.9B) not due until after 2028. So no imminent refinancing cliff. The company even issued some new debt in 2023 at ~5.25% for 10-year notes, which given high interest rates, shows confidence from debt investors. Financial stability is high, and the company has liquidity (over $1.69B cash on hand and undrawn credit lines).
Balance Sheet Health: Besides debt, S&P’s balance sheet has large goodwill/intangible assets (~$50B) – expected after a big merger. Tangible equity is negative, but that’s not concerning for such a cash-generative business. The company does carry non-controlling interests of about $3.8B on the balance sheet, largely representing the ~27% minority in S&P Dow Jones Indices owned by CME Group and News Corp. There are put/call arrangements on those stakes in the future, but S&P has ample capacity should it ever need to purchase them. The company’s debt ratios (debt to EBITDA, interest coverage, etc.) are all within comfortable ranges for an AA/AA- type profile. S&P’s working capital is usually negative (since they have large deferred revenue from subscriptions – customers pay in advance, which is essentially “float” for S&P). Negative working capital is actually a source of cash and a sign of a good subscription model.
7.2. CAPEX and Expenses
As shown before, the business model is asset-light (Capex is minimal) and highly scalable – once data or ratings are produced, they can be sold repeatedly at little incremental cost.

7.3. Income Statement
S&P Global ($SPGI) has demonstrated strong and consistent revenue growth, reaching $14.21 billion in Q4 2024. Over the past 1, 2, 5, and 10 years, revenue has compounded at 13.68%, 12.73%, 16.22%, and 10.71% CAGR, respectively, highlighting its sustained expansion and pricing power.
Notably, revenue growth accelerated post-2021, likely driven by M&A (IHS Markit merger), increased demand for financial data, and pricing strength in credit ratings and indexing services. While there was some stagnation in the mid-2000s, recent trends suggest SPGI is capitalizing on secular growth in financial analytics and passive investing.

This trajectory reinforces SPGI’s long-term compounding potential, making it a high-quality business with strong market positioning.
Importantly, S&P’s revenue mix shift after the merger means more recurring revenue. In 2021 (pre-merger), subscription revenue was 39% of total; by 2024 it’s 52%. This bodes well for smoother growth ahead. Geographically, S&P gets 61% of revenue from the U.S. and 39% international, giving it broad exposure.
Profitability: S&P is a cash cow. In 2024, operating profit margin was ~39% (excluding one-offs). Segment margins are impressive: Ratings ~57% adjusted op margin for 2024, Market Intelligence ~33%, Indices a whopping ~69%, Commodity ~46%, Mobility ~39%. Few companies boast such margins across multiple lines.
Net income (GAAP) was $3.85B in 2024 (up 46% from previous year).

7.4. Cashflow Generation
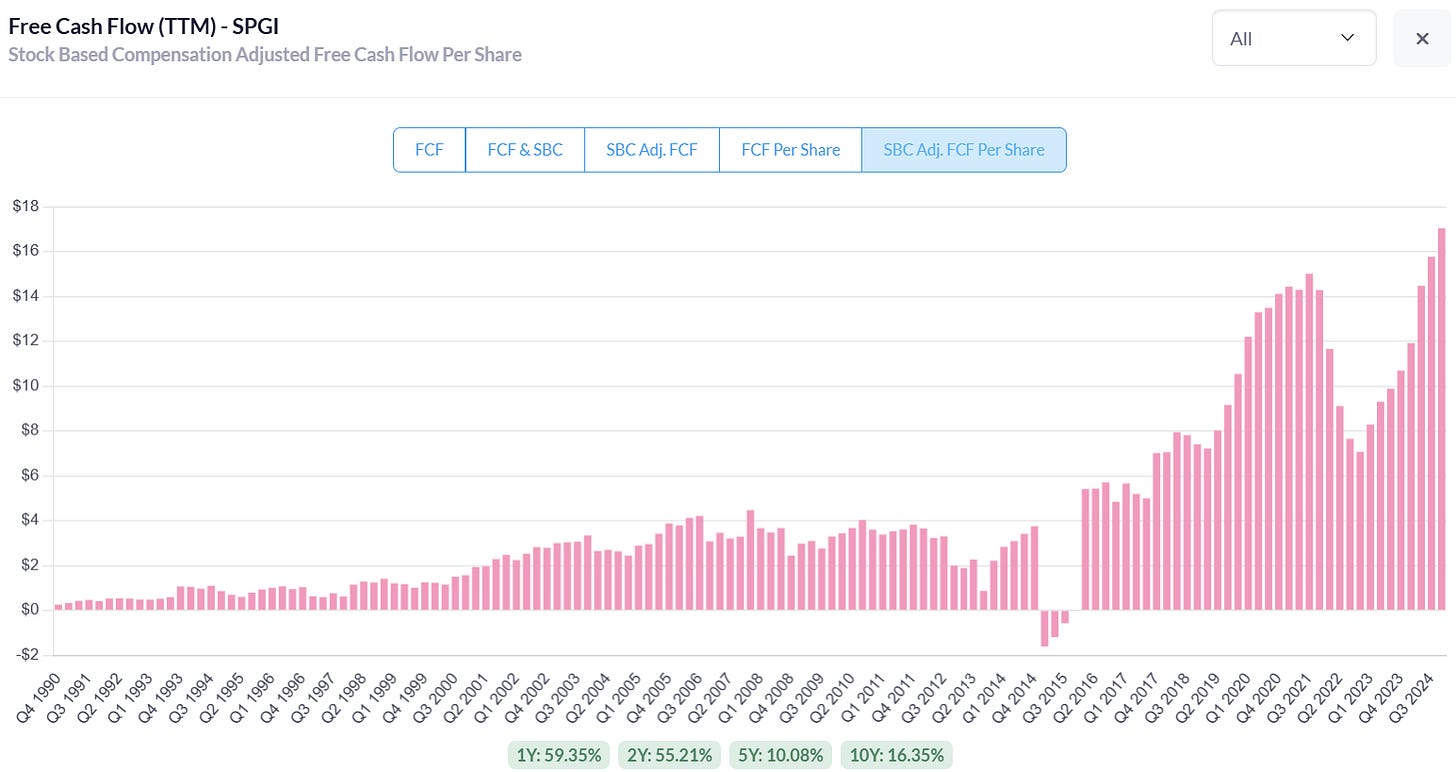
S&P Global ($SPGI) has seen explosive free cash flow (FCF) growth, reaching $5.57 billion in Q4 2024. Over the past 1, 2, 5, and 10 years, FCF has grown at 56.01%, 48.78%, 15.90%, and 17.42% CAGR, respectively, demonstrating strong operational efficiency and capital discipline.
The significant jump in FCF post-2021 aligns with SPGI's IHS Markit acquisition, which expanded its data and analytics business. The company’s high-margin, subscription-based revenue model allows it to generate substantial cash flows with minimal reinvestment needs.
This FCF expansion strengthens SPGI’s ability to allocate capital effectively through buybacks, dividends, and acquisitions, reinforcing its shareholder-friendly capital allocation strategy.
7.5. Stock-Based Compensation
Stock-based compensation (SBC): S&P’s SBC expense was $247M in 2024, up from $171M in 2023. While $247M is not trivial, it’s only ~1.7% of revenue – quite reasonable. S&P has been actively offsetting dilution from SBC via buybacks; in fact, the share count has been trending down (from ~320M in 2021 to ~312M by 2024). So, SBC is not causing net dilution – management essentially “buys back” any shares given to employees (and then some). Over the long term, S&P’s share count is roughly flat to slightly declining, which boosts per-share metrics.

7.6. Comparison with competitors
Moody’s (MCO): In 2023, Moody’s had ~$6.5B revenue (MCO 2024 around $7B) – roughly half of S&P’s. Moody’s operating margin is also very high (mid-40%s adjusted). Both companies have similar economic models and both trade at premium valuations. One difference is Moody’s is less diversified (more reliant on ratings). Moody’s also has debt (about $7B) but slightly lower leverage than S&P in ratio terms. When comparing debt levels, S&P’s net debt/EBITDA (~2.7x) vs Moody’s (~2x) – S&P took on more for IHS. But S&P’s much larger EBITDA makes its absolute debt quite comfortable. On growth, Moody’s had a tougher 2022 (organically down more due to ratings slump) but bounced back in 2024 with near 20% revenue growth (including a big issuance rebound). Over five years, S&P grew faster (16% CAGR vs Moody’s 8% CAGR) due to its broader exposure and acquisitions.
MSCI: Smaller, ~ $2B revenue, but margins ~50% and very high valuation (often 40x earnings). MSCI focuses on indices and analytics for asset managers. S&P’s index business is comparable to MSCI’s in profitability. A key difference: MSCI is purely subscription/licensing, no cyclical ratings. It grew ~10% in 2023. S&P’s growth is more balanced across segments.
London Stock Exchange Group (LSEG): After buying Refinitiv, LSEG has a large data division (similar size to S&P’s Market Intelligence). LSEG’s data business growth has been mid-single digits, and margins ~30%. S&P’s MI margins are similar, but S&P overall margin is higher due to ratings/indices. LSEG carries a lot of debt from the deal, but they have exchange revenue too.
FactSet: $2B revenue, ~30% op margin. FactSet is like a mini-S&P MI, focusing on investment management clients. It grows ~6-8%. S&P MI is larger and ironically competes with FactSet on some accounts, but S&P can bundle with other segments.
Bloomberg: Private, estimated >$10B rev but high cost base (thousands of journalists, etc.), so margin likely lower. Hard to compare but Bloomberg terminal is sticky at high price – S&P’s CapIQ is a cheaper alternative many smaller firms use.
In sum, S&P’s financials paint the picture of a highly profitable, cash-generative firm with prudent financial management. It has more debt now due to the IHS acquisition, but leverage is still moderate and being managed down over time (they may not rush to pay it off given cheap rates locked in). The company’s ability to invest in growth (organically or via M&A) while also returning significant cash to shareholders is a very attractive combination.
Bottom line: S&P Global’s financial footing is rock-solid. It’s profitable in good times and bad, throws off ample cash, and allocates capital shrewdly. The company’s financial resilience (as evidenced by maintaining margins even during issuance downturns and quickly de-levering after big deals) gives confidence that it can navigate future challenges while continuing to deliver growth. Next, we’ll look at how the market is valuing S&P and whether that presents an attractive opportunity.
8. Valuation
S&P Global’s stock carries a premium valuation, reflecting its high quality and growth prospects. We need to assess if that premium is justified and how current valuation compares to history and peers. Key metrics to examine are Free Cash Flow (FCF) per share, Price-to-Earnings (P/E) ratios (both current and forward), and their historical trends.
As of early 2025, SPGI stock trades around the mid-$400s (it’s been in the ~$450–$500 range). Let’s use approximate figures: price ~$480.
FCF per share (trailing 12 months): Using end of 2024 data, FCF/share is about $17.84. That puts the Price/FCF ratio ~27x, which equates to an FCF yield of ~3.7%. For context, this FCF yield is slightly above S&P’s recent historical average – the 5-year average FCF yield is ~3.0%, so currently investors are getting a bit more cash flow for the price. Part of this is because 2022’s depressed FCF rebounded strongly in 2023/24 (so the market may not have fully caught up to the higher FCF yet). A ~3.7% FCF yield is not cheap in an absolute sense – e.g. it’s roughly comparable to the yield on 10-year treasuries. However, investors likely expect S&P’s FCF to grow significantly, making that yield more attractive on a forward basis.
Next Twelve Months (NTM) FCF/share: For 2025, analysts might project FCF to grow perhaps 10-15% (given revenue growth ~7% and some margin expansion). If we take FCF/share perhaps around $20 next year, the forward P/FCF would be ~24x (yield ~4.2%). This suggests the stock’s valuation is anticipating future growth (the yield on forward FCF is higher than trailing, indicating growth).

P/E (trailing): Using GAAP EPS can be misleading due to amortization. Trailing 2024 GAAP EPS is around $12.00–$12.50 (since 2024 net income was ~$3.85B over ~315M shares). That would put trailing P/E ~38–40x. S&P has often been valued on adjusted earnings given the large amortization from acquisitions (non-cash). The current P/E might look high because 2023 GAAP EPS was lower ($8.23 due to one-offs). It’s more sensible to consider normalized earnings power.

NTM P/E (forward P/E): Based on consensus for 2025, let’s say expected GAAP EPS ~$13 and adjusted EPS ~$15. At a ~$480 stock price, that’s forward P/E of ~32x GAAP, ~... 32x adjusted (since adjusted is higher EPS, P/E lower, but stock price also moves with those expectations). Stock analysis sites show forward P/E around 28–30, likely depending on the exact forward period. Using early 2025 as current, forward 12-month likely means full-year 2025 EPS ~ $15–$16, giving ~30x.


To simplify: S&P trades roughly at 30–35 times earnings and ~25–30 times free cash flow. That is a rich multiple, certainly above the market (the S&P 500 index is ~18x forward earnings as of 2025). But S&P is not alone: Moody’s similarly trades at ~30x forward earnings. MSCI trades even higher (often 40x+). So in its peer group of elite financial data firms, S&P’s valuation is within the norm. The market essentially treats SPGI as a secular growth/quality compounder – akin to a high-growth tech stock or a consumer monopoly – hence the premium.
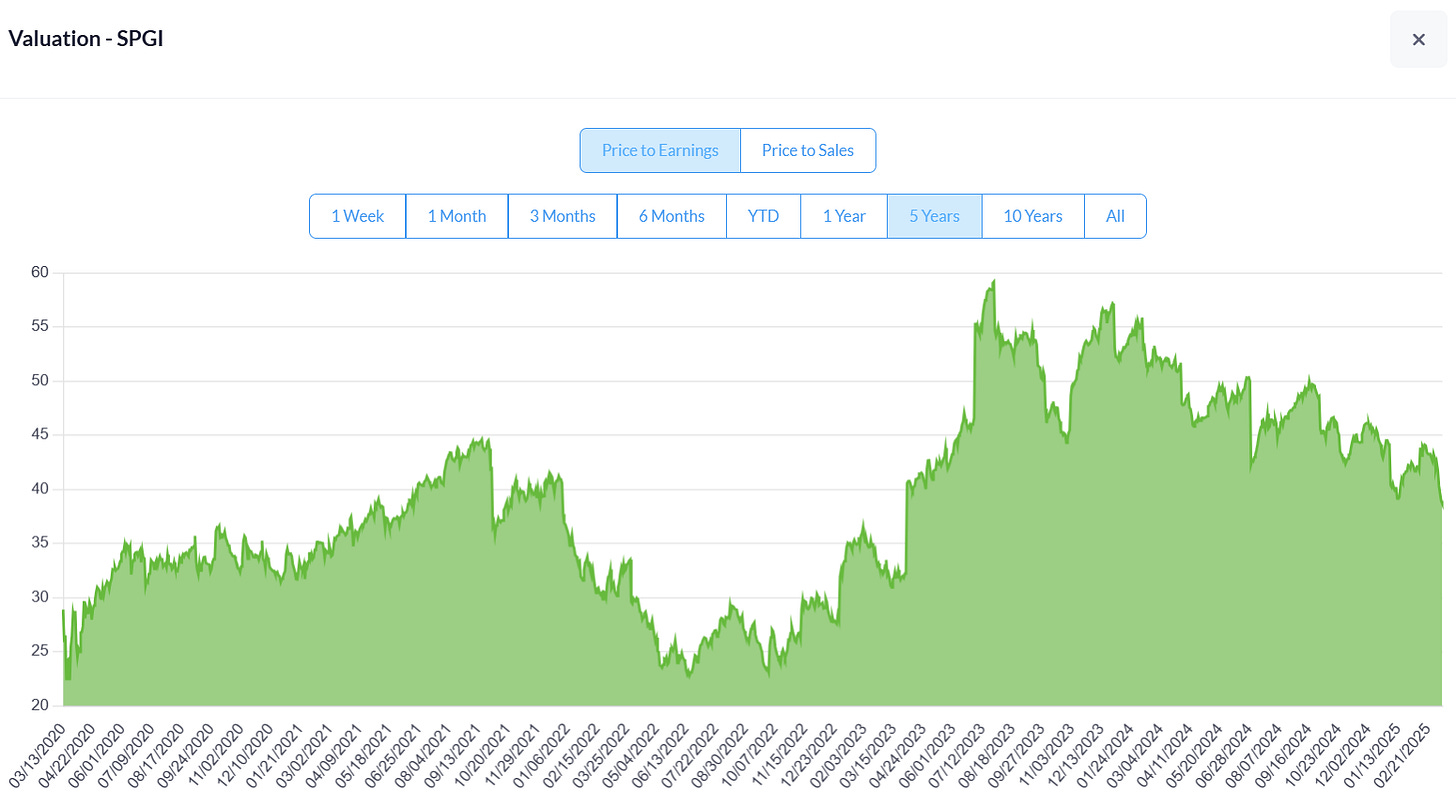
Historical valuation trends: Over the past decade, S&P’s P/E has expanded. Back in 2013–2014, it was in the high-teens to low-20s. As the company proved its resilience and growth, and as interest rates fell (making high-quality earnings more valuable), the multiple rose. For much of 2017–2019, SPGI traded ~20–25x earnings. Post-COVID, in the low-rate environment and after the IHS deal, the stock hit even higher multiples (40x+). The 5-year average P/E (on adjusted earnings) is probably around 25–30x. Right now, it’s a bit above that range on trailing basis. On a price-to-free-cash flow basis, Macrotrends data shows S&P averaged ~23x P/FCF in 2022, and it’s higher now (~27x). But note 2022’s FCF was artificially low (making P/FCF look low). A better indicator is the FCF yield – currently ~3.7% vs 5-year avg 3.0% – implying the stock is not at peak valuation; it has come down from the peak optimism of late 2021 when yield was <2%. Indeed, in late 2021 SPGI stock hit around $480 which was about 36x forward earnings then; after the 2022 sell-off, valuations moderated.
The market seems to be balancing S&P’s predictable growth (management guided to low-double-digit EPS growth medium-term, which they’ve been achieving) with the reality of higher interest rates (which typically compress P/E multiples). At ~30x forward earnings, investors are effectively paying for growth – expecting, say, 10%+ annual EPS growth and willing to accept a 3% yield in the interim. Given S&P’s track record and moat, many see that as justified for a long-term holding.
Valuation relative to growth (PEG ratio): If SPGI grows EPS ~10–12% per year, a P/E of ~30x gives a PEG around 2.5–3. This is higher than say a normal PEG=1 for undervalued situations, indicating it’s not a value stock but a growth stock. However, a PEG of 2-3 isn’t unusual for companies of this caliber (Moody’s PEG is similar; MSCI’s even higher).
Comparison to peers:
Moody’s (MCO) currently trades around 28x forward earnings (and ~36x trailing GAAP, similar ballpark to SPGI). Moody’s FCF yield is ~3% (a bit lower than SPGI’s), reflecting perhaps that Moody’s has slightly more near-term cyclicality exposure.
MSCI trades ~40x forward, because of pure recurring revenue and high growth expectations (and maybe a scarcity premium as a pure ESG/index play).
FactSet trades ~26x forward, a bit cheaper, likely due to slower growth and smaller moat.
Exchanges (like CME, ICE) which have data businesses trade around 20–25x, but their growth is lower and their business mix different (and they have cyclical volume components). So SPGI’s valuation is high but not out of line in context – investors in this space are simply willing to pay up for consistent mid-teens total return potential.

Free Cash Flow per share and PE trends historically: Pre-merger, SPGI’s FCF/share grew nicely (it roughly doubled from 2015 to 2020). The price kept pace, so FCF yield stayed ~3%. Post-merger, a lot of shares were issued but then aggressively bought back – effectively share count went from ~241M in 2021 to ~308M in 2023 (up from merger, then down from buybacks). FCF/share dipped in 2022 due to one-offs and share issuance, but now is hitting new highs (expected to surpass $20 within a year or two). The market has historically valued S&P at a FCF yield of ~3%; today it’s around ~3.5%. This could imply a slight undervaluation relative to its own history if one believes the business has the same or better prospects. It could also reflect a new normal with higher interest rates (investors demanding a bit more yield now).
Current valuation multiples: Summarizing:
Trailing GAAP P/E: ~40x (affected by amortization, not too meaningful by itself).
Trailing adjusted P/E: ~34–35x.
Forward P/E (NTM): ~29x (give or take a couple).
Trailing P/FCF: ~27x.
Forward P/FCF: likely ~24x.
EV/EBITDA: For a different angle, enterprise value ~$165B (market cap $153B plus net debt ~$10B), divided by EBITDA ~$5.8B gives ~28x EV/EBITDA. That’s high, but note EBITDA includes the huge amortization as expense – if you considered EBITA (earnings before amortization) it’s a bit lower multiple.
Historical ranges: SPGI’s P/E has ranged from ~15x (during 2011 euro crisis) to ~40x (peak optimism). The stock fell to ~$270 in the 2022 bear market (P/E then ~20x forward, a rarity and an arguably great entry). Since then, it rallied back. So currently it’s toward the higher end historically but not at the absolute peak. Given interest rates are higher than in most of the last decade, one could argue a slightly lower multiple is warranted than those peak days. On the other hand, S&P is a larger, more diversified, arguably less risky business now than 5-10 years ago, which supports a premium.
Valuation in context of risk and growth: The key question – is SPGI worth 30x earnings? If we expect, say, 12% EPS CAGR over next 5 years (which is plausible with high single-digit revenue growth plus some margin and buybacks), then in 5 years EPS might be ~1.76x current (since 1.12^5 ≈1.76). If the P/E in 5 years compresses to say 25x (some multiple contraction), the stock price would still be 1.76 * (25/30) = ~1.47x today’s price. That implies ~8% annual price return, plus ~1% dividend = ~9% annual total return. If the multiple holds at 30x, then return would mirror EPS growth ~12%+dividend = ~13%. If things exceed expectations, it could be higher. Conversely, bearish scenario: if growth disappoints or rates force a 20x P/E, and EPS grows slower (say 8%), in 5 years price might be 1.47 (EPS growth) * (20/30) = 0.98x today, basically flat, plus dividends ~ maybe low single-digit total return – not disastrous but not great.
So upside is solid if execution continues, but the valuation does create sensitivity to growth execution and interest rates. This is why some argue the stock has “overpriced optimism”.
Valuation relative to risk: It’s noteworthy that SPGI’s stock beta is around 0.95 – not extremely volatile, but it will move with markets. In downturns, it can drop more than broad market (as seen in 2022 when cyclicals sold off). But over very long term, the volatility has paid off with outperformance.
Conclusion on valuation: S&P Global is not a bargain-basement stock by any stretch. It’s a classic case of paying up for quality. For investors with a long horizon, the valuation can be digested if one believes S&P will continue compounding at double-digit rates. The current multiples are somewhat above historical median, which could mean near-term upside might be limited until earnings “catch up” further or if interest rates decline (which could expand multiples again). However, given S&P’s near-monopoly characteristics and growth outlook, the premium seems fundamentally supported – it’s hard to envision S&P ever trading at a market multiple unless something goes very wrong or in a severe bear market.
We should also consider a sum-of-parts view: if you value Ratings like Moody’s (~20x EBITDA), Indices like MSCI (~25-30x EBITDA), MI comparable to FactSet (~20x EBITDA), etc., you end up near current valuation, implying not much conglomerate discount if any. In fact, some might argue S&P deserves a slight conglomerate premium because its diversification reduces risk relative to any one of those pure-plays.
In summary, SPGI’s valuation is high but largely justified by its resilient growth and moat. The stock isn’t “undervalued” in the traditional sense, but for investors seeking a reliable compounder, it still offers an attractive profile of growth relative to risk. One should expect multiples to remain elevated given the franchise. The key is whether S&P can continue its growth trajectory to drive stock appreciation from here – which leads us to wrap up our thesis and scenarios for the future.
9. Conclusion
Final Take: S&P Global stands out as a best-in-class franchise that has proven its ability to grow and prosper through varied market conditions. It combines the defensive qualities of an essential service provider (recurring revenue, high margins, strong moat) with offensive growth catalysts (increasing global financial activity, data revolution, and smart expansion moves). As an investment, SPGI offers a compelling long-term opportunity for those willing to pay a fair price for excellence.
In our view, S&P Global is akin to the “Swiss Army knife” of financial markets – it has a tool for every environment. When debt markets boom, its Ratings division thrives; when equity markets roar, its Indices reap fees; when markets are volatile or complex, clients demand more of its data and analytics to navigate. This dynamic allows S&P to weather storms and capitalize on calm seas alike. The company’s track record of consistent revenue/EPS growth and shareholder-friendly capital returns (over $23B+ returned in three years) underlines management’s commitment to delivering value.
At the current juncture, the bull case for SPGI is that it will continue to compound earnings at a healthy clip (low-teens annually) fueled by:
Ongoing secular trends (more assets in passive index funds, more data consumption, a coming wave of debt refinancing).
Successful integration of IHS Markit, unlocking new revenue synergies and efficiency.
Pricing power and innovation allowing it to slightly expand margins or at least maintain them, even as it invests in growth areas like ESG and private markets.
The possibility of incremental upside from things like eventually buying out the remainder of the S&P Dow Jones Indices JV (which could simplify the structure and give full profit access), or further savvy acquisitions that complement its portfolio.
The bear case primarily hinges on valuation and cyclicality. The stock could underperform if, for instance, credit issuance remains soft for longer (pressuring near-term growth) or if interest rates stay elevated, prompting a market rotation away from high-multiple stocks. There’s also a scenario where regulators throw a curveball – say, the EU’s push to use alternatives to the Big Three gains traction (even though attempts so far have barely dented market share). Additionally, any shock to the financial system that reduces overall market activity (fewer deals, lower AUM) would hit SPGI’s revenue in multiple places – an acute risk albeit likely a temporary one.
One should also keep an eye on competition creeping in: while S&P’s moat is wide, competitors like Moody’s aren’t sitting idle. If Moody’s Analytics or others begin eroding S&P’s growth in Market Intelligence, or MSCI steals big index contracts, it could modestly slow S&P’s momentum. So far, however, S&P has more often been the disruptor (e.g., encroaching on FactSet’s turf) than the disrupted.
Balancing these, we find the bullish argument more convincing for a long-term investor. S&P’s diversified model means it isn’t overly exposed to any single risk. Even in a downside scenario, the company’s profit and cash flow generation would likely remain strong – perhaps growth would pause, but not collapse. And given management’s demonstrated agility, they might use any soft period to cut costs or make opportunistic moves (for instance, if the stock dipped, they could ramp up buybacks at lower prices – a scenario where long-term holders ultimately win).
From a portfolio perspective, SPGI offers a unique mix of stability and growth. It’s almost like an “information utility” – deeply embedded in the financial infrastructure – which tends to be a lucrative place to be. Shareholders get to ride the overall growth of global capital markets with less volatility than owning a bank or an exchange, and with higher margins to boot.
Investment Decision: For investors with a multi-year horizon, we conclude that S&P Global is a buy-worthy candidate, despite its elevated valuation. The reasoning: quality compounders earn their premium. Buying S&P is essentially buying a slice of the world’s increasing financial complexity and volume – a trend that shows no sign of abating. As long as people borrow, invest, and seek data (and it’s hard to imagine a world where they stop), S&P will be there monetizing those activities. Few companies have such an entrenched position at the crossroads of global finance.
That said, new investors might consider phasing into the position given short-term valuation risk – for example, starting with a partial allocation and adding on any market pullbacks. Trying to time the perfect entry is tough (as any dip tends to be fleeting because buyers step in for this name), but maintaining discipline with position sizing is wise.
In conclusion, S&P Global is the kind of stock one can buy and hold for years, even decades, with confidence. It embodies the Warren Buffett ideal of a company with a wide moat, run by able managers, in an enduring business – though Mr. Buffett might grumble about the price, he’d surely appreciate the franchise. With the information provided in this report, investors should feel better equipped to judge SPGI’s merits and make an informed decision. For those seeking a cornerstone investment in the financial sector that marries stability and growth, S&P Global fits the bill – as long as you’re prepared to tolerate some periodic bumps in the market, the long-term road looks promising.
10. 5-Year Scenario Projections (Excel Model for Paid Subscribers)
For our premium subscribers, we’ve developed a detailed 5-year projection model in Excel, which can be accessed separately. The Deep Dive will be accessible for one month. After that, it, along with the Excel template, will be available exclusively to premium subscribers.
Below, we summarize the key outcomes of our Base, Bull, and Bear scenarios:
Base Case (Most Likely Scenario):
Keep reading with a 7-day free trial
Subscribe to Swiss Transparent Portfolio to keep reading this post and get 7 days of free access to the full post archives.